Fig. 3.
Download original image
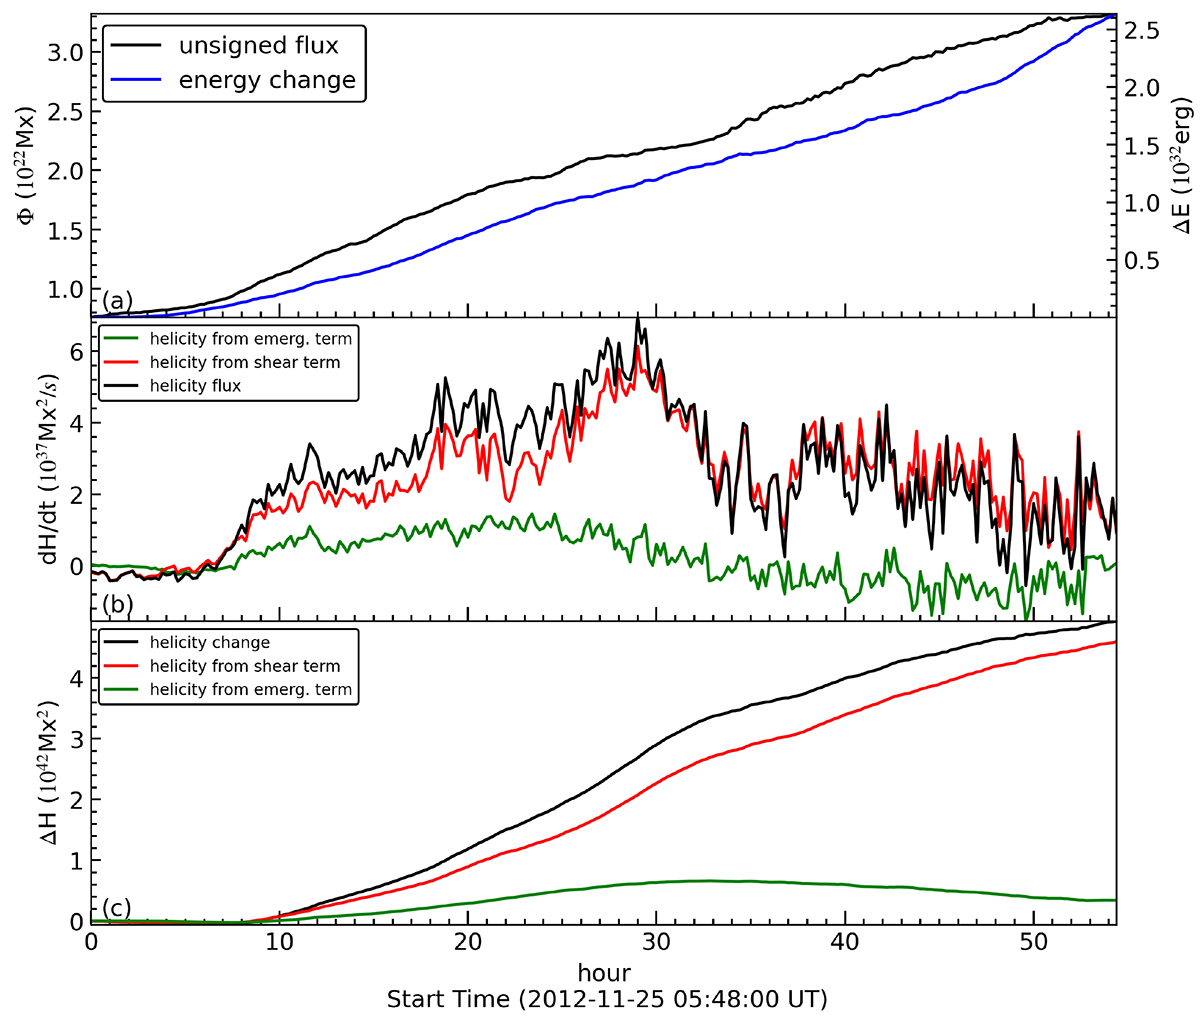
Time profiles of the magnetic flux, helicity, and energy for the Type-I AR 11620. Panel (a): time evolution of the unsigned magnetic flux Φ (black) and accumulated energy ΔE (blue). Panel (b): time profile of the helicity flux, d(H)/dt (black). The red and green curves represent the shear and emergence terms, respectively. Panel (c): time profiles of accumulated helicity ΔH. The red and green curves indicate the helicity of the emergence term and shear term, respectively.
Current usage metrics show cumulative count of Article Views (full-text article views including HTML views, PDF and ePub downloads, according to the available data) and Abstracts Views on Vision4Press platform.
Data correspond to usage on the plateform after 2015. The current usage metrics is available 48-96 hours after online publication and is updated daily on week days.
Initial download of the metrics may take a while.