Fig. 1.
Download original image
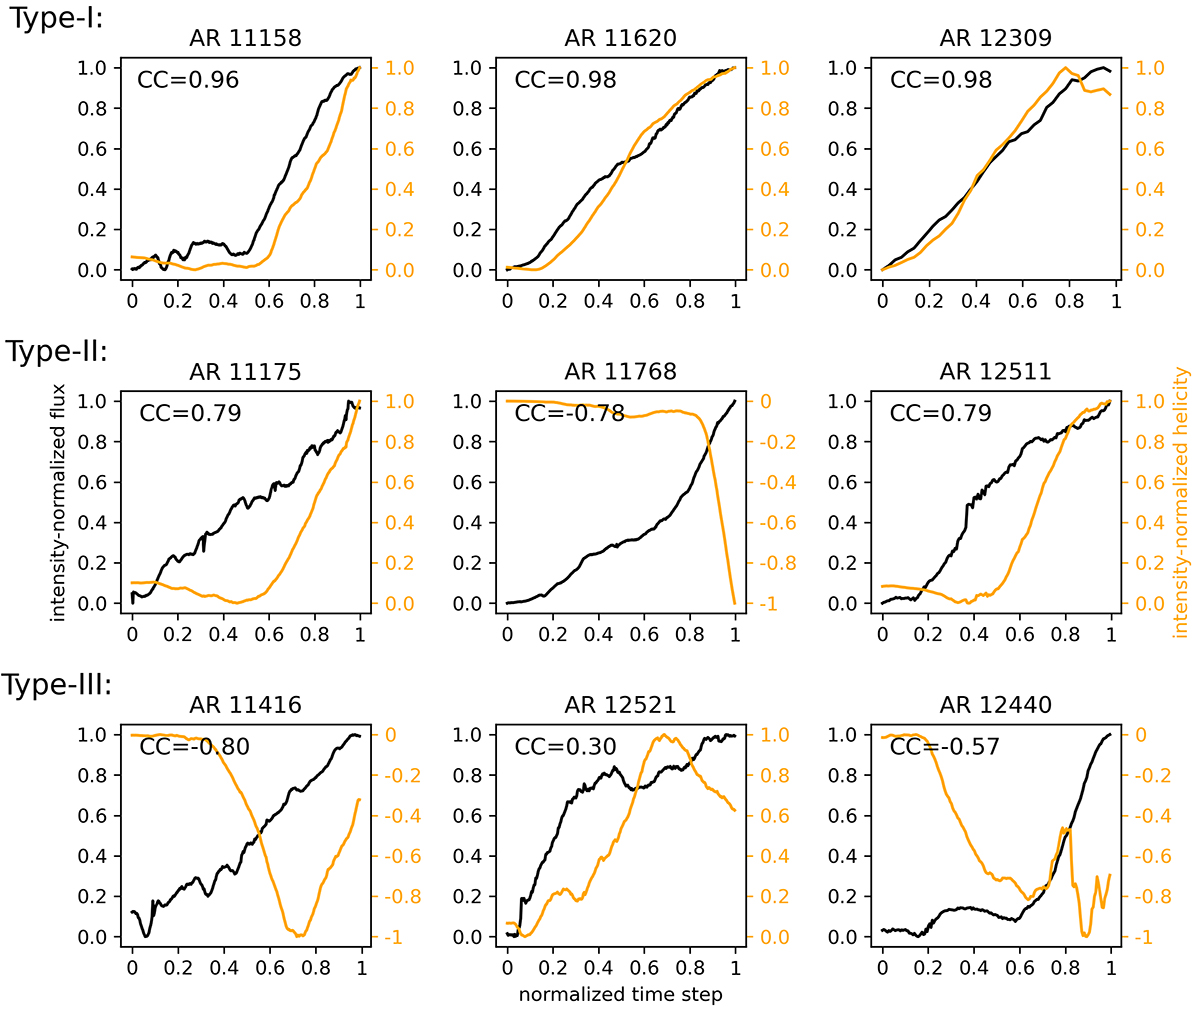
Unsigned magnetic flux Φ (blacks curve) and accumulated magnetic helicity ΔH (orange curves) evolutions for nine examples. The top, middle, and bottom rows represent the Type-I, Type-II, and Type-III ARs, respectively. The decreasing helicity indicates a negative helicity injection. The correlation coefficients between the two curves are marked in the upper-left corner of each panel.
Current usage metrics show cumulative count of Article Views (full-text article views including HTML views, PDF and ePub downloads, according to the available data) and Abstracts Views on Vision4Press platform.
Data correspond to usage on the plateform after 2015. The current usage metrics is available 48-96 hours after online publication and is updated daily on week days.
Initial download of the metrics may take a while.