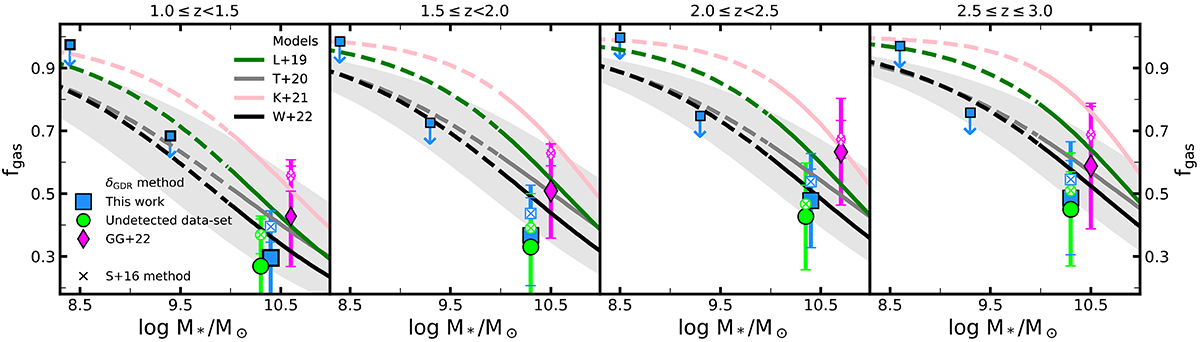
Fig. 6.
Download original image
Gas fractions versus stellar masses derived for each redshift range. Squares represent the gas fractions obtained for our sample, circles show the gas fractions derived for the undetected data set. Diamonds represent the gas fractions calculated for the GG22 galaxies only. The differences between samples highlight the effect of the exclusion and inclusion of individually detected galaxies in the gas fractions. Gas fractions from the colored filled markers are computed following the gas-to-dust ratio prescription whereas colored empty markers with a cross within represent the gas fractions as calculated using the S16 method (only for the high-mass bin, upper limits are only computed following the gas-to-dust ratio method). Both values are included in Table B.1. The 3σ upper limits at lower stellar masses are shown with smaller squares and vertical arrows. Uncertainties are also included for the measurements. We also show the Liu et al. (2019a, L19), Tacconi et al. (2020, T20), Kokorev et al. (2021, K21), and Wang et al. (2022, W22) scaling relations in green, gray, pink, and black, respectively. For each line, there is a dashed and a solid part. The solid part represents the mass range for which these relations are calibrated, whereas the dashed one shows an extrapolation of these relations for lower stellar masses. For the T20 relation, we also include the uncertainty as a shaded gray region. The scaling relations are computed using the median redshift of each bin and a ΔMS = 0 dex. The distance from each of the points to these scaling relations is re-scaled to their corresponding redshifts and ΔMS using T20.
Current usage metrics show cumulative count of Article Views (full-text article views including HTML views, PDF and ePub downloads, according to the available data) and Abstracts Views on Vision4Press platform.
Data correspond to usage on the plateform after 2015. The current usage metrics is available 48-96 hours after online publication and is updated daily on week days.
Initial download of the metrics may take a while.