Fig. 4.
Download original image
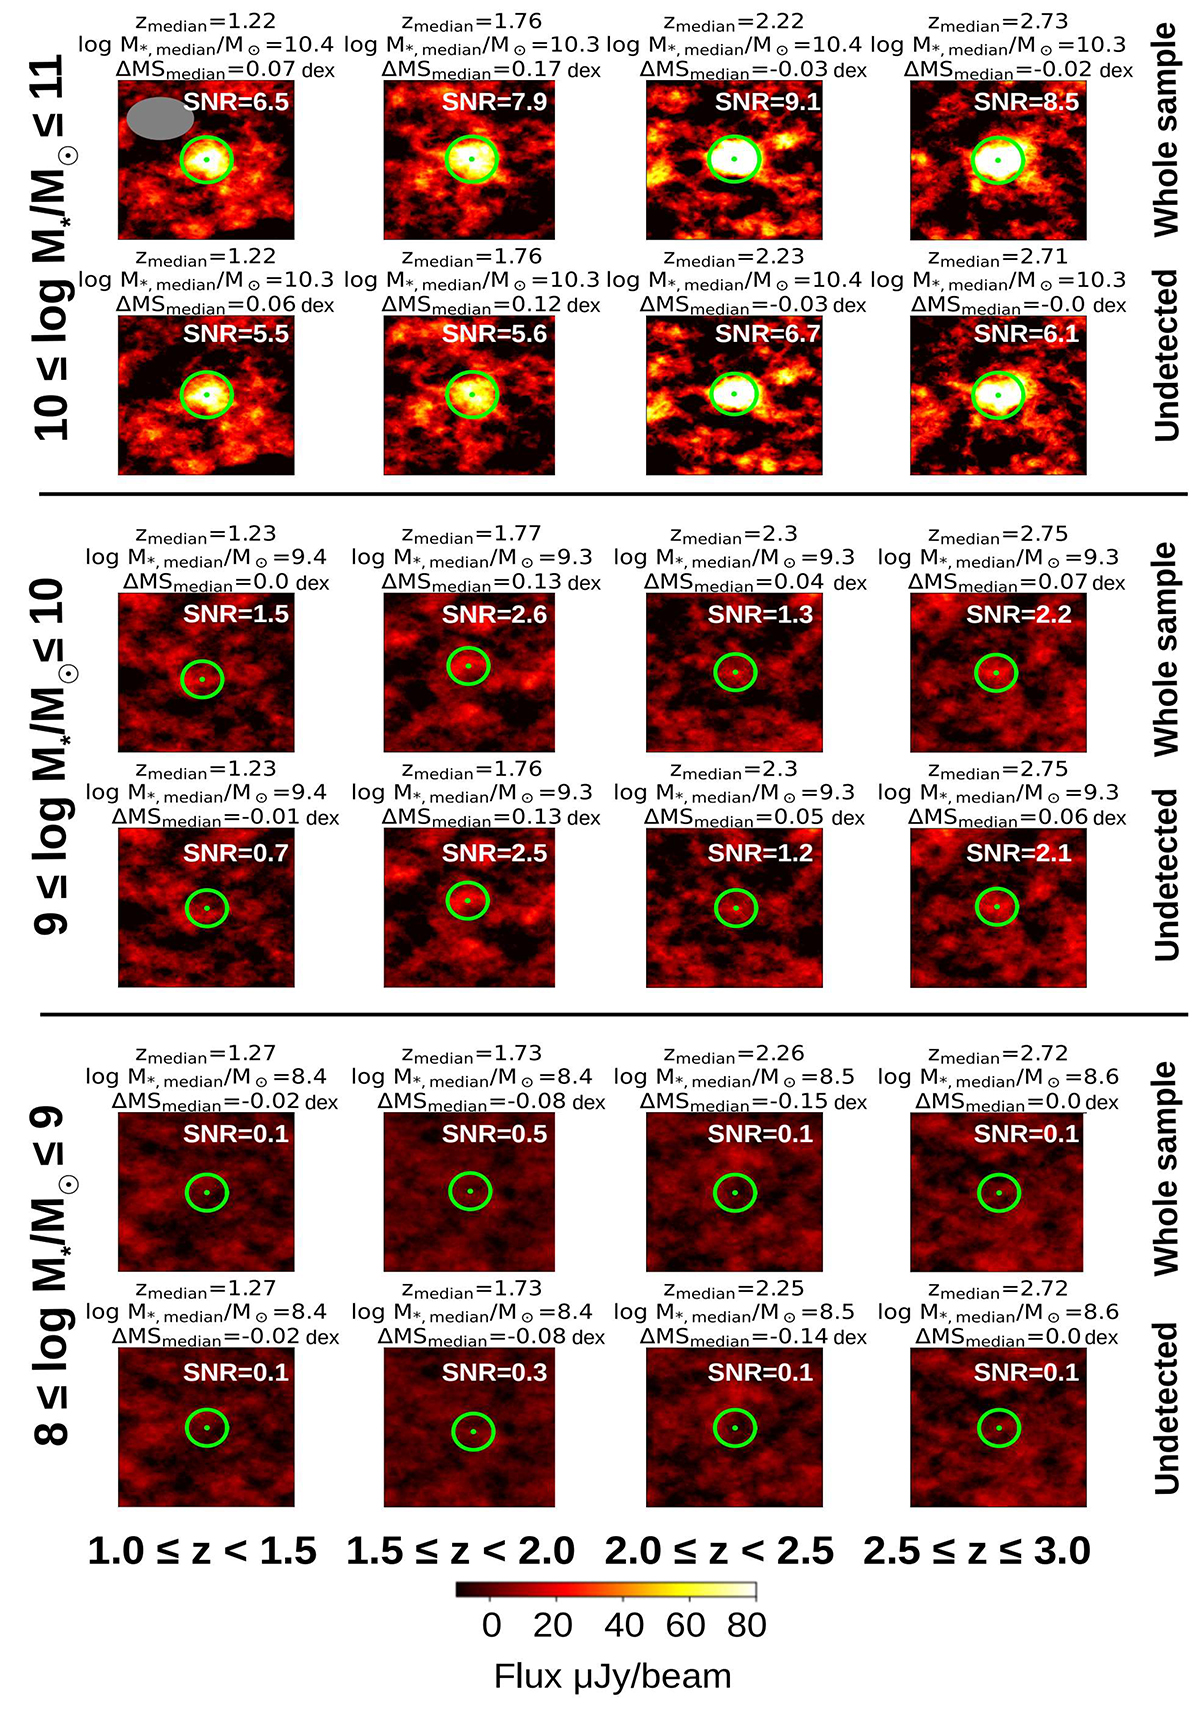
Cutouts of 7 × 7 arcsec2 of the ALMA low-resolution map showing the median stacked galaxies in each redshift and mass bin. For each bin, we include cutouts that correspond to the whole sample and the undetected data set, as defined in Sect. 2. The apertures used to measure the photometry are displayed in green. The size of the beam is shown in the first panel of the figure in gray. The flux densities and the corresponding uncertainties for each stacked galaxy are included in Table 2.
Current usage metrics show cumulative count of Article Views (full-text article views including HTML views, PDF and ePub downloads, according to the available data) and Abstracts Views on Vision4Press platform.
Data correspond to usage on the plateform after 2015. The current usage metrics is available 48-96 hours after online publication and is updated daily on week days.
Initial download of the metrics may take a while.