Open Access
Fig. 3.
Download original image
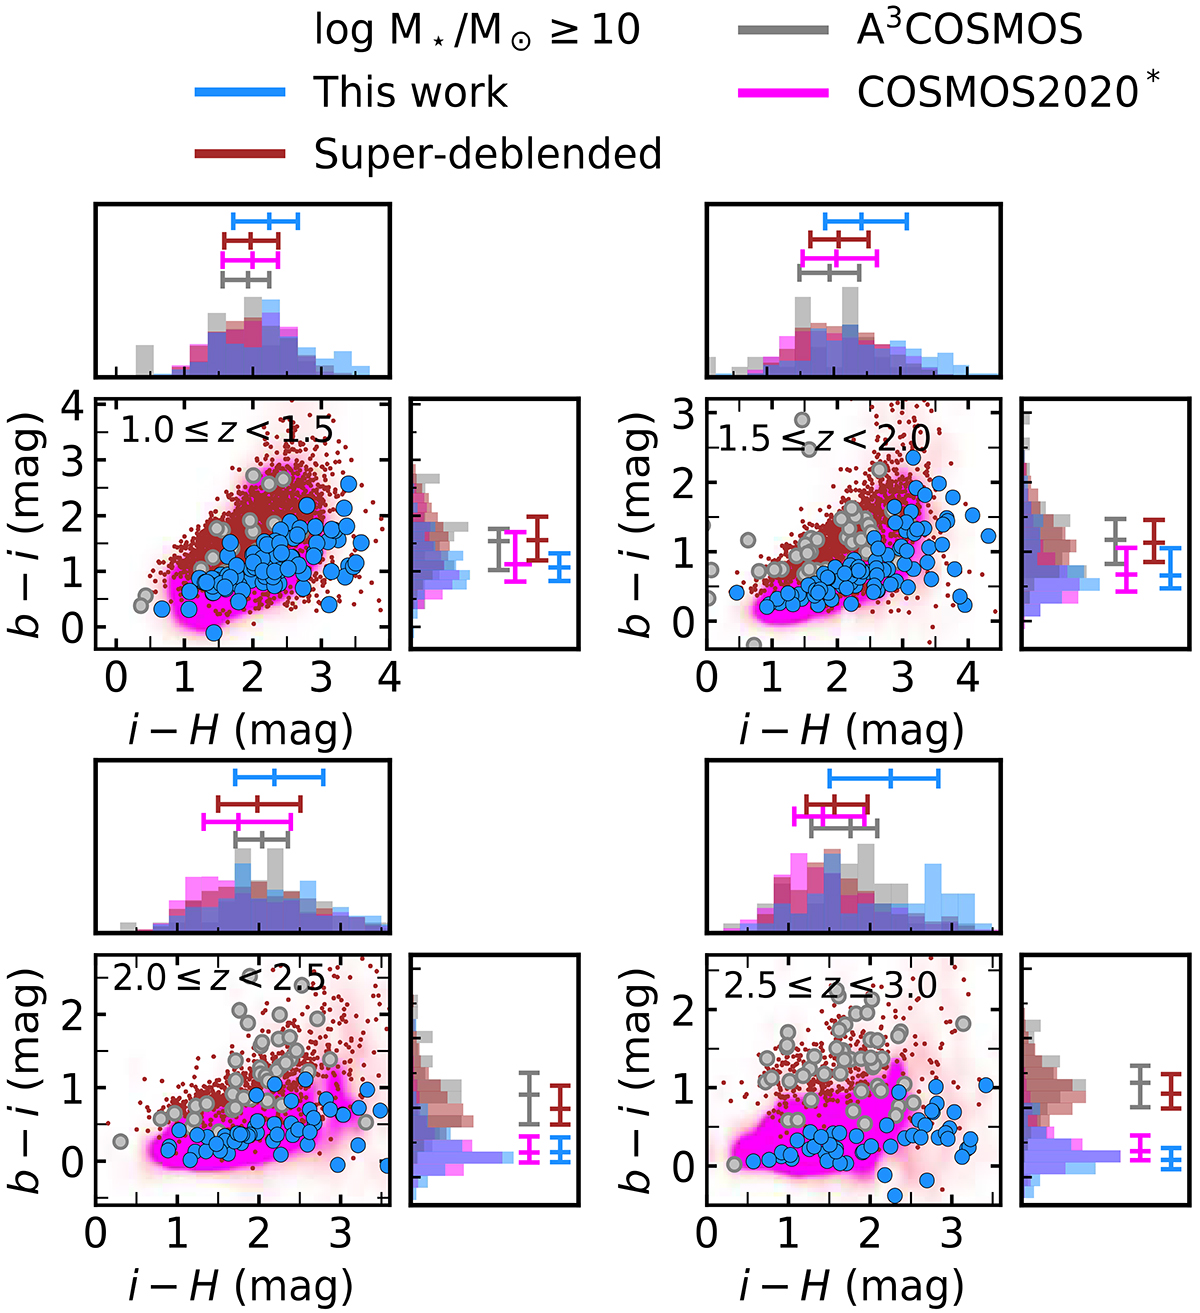
Color-versus-color diagram based on i − H and b − i in different redshift bins. We only include galaxies with M⋆ ≥ 1010 M⊙ within our data set, the super-deblended catalogs, A3COSMOS, and COSMOS2020*. See Fig. 2 for the description of the color codes and markers here shown.
Current usage metrics show cumulative count of Article Views (full-text article views including HTML views, PDF and ePub downloads, according to the available data) and Abstracts Views on Vision4Press platform.
Data correspond to usage on the plateform after 2015. The current usage metrics is available 48-96 hours after online publication and is updated daily on week days.
Initial download of the metrics may take a while.