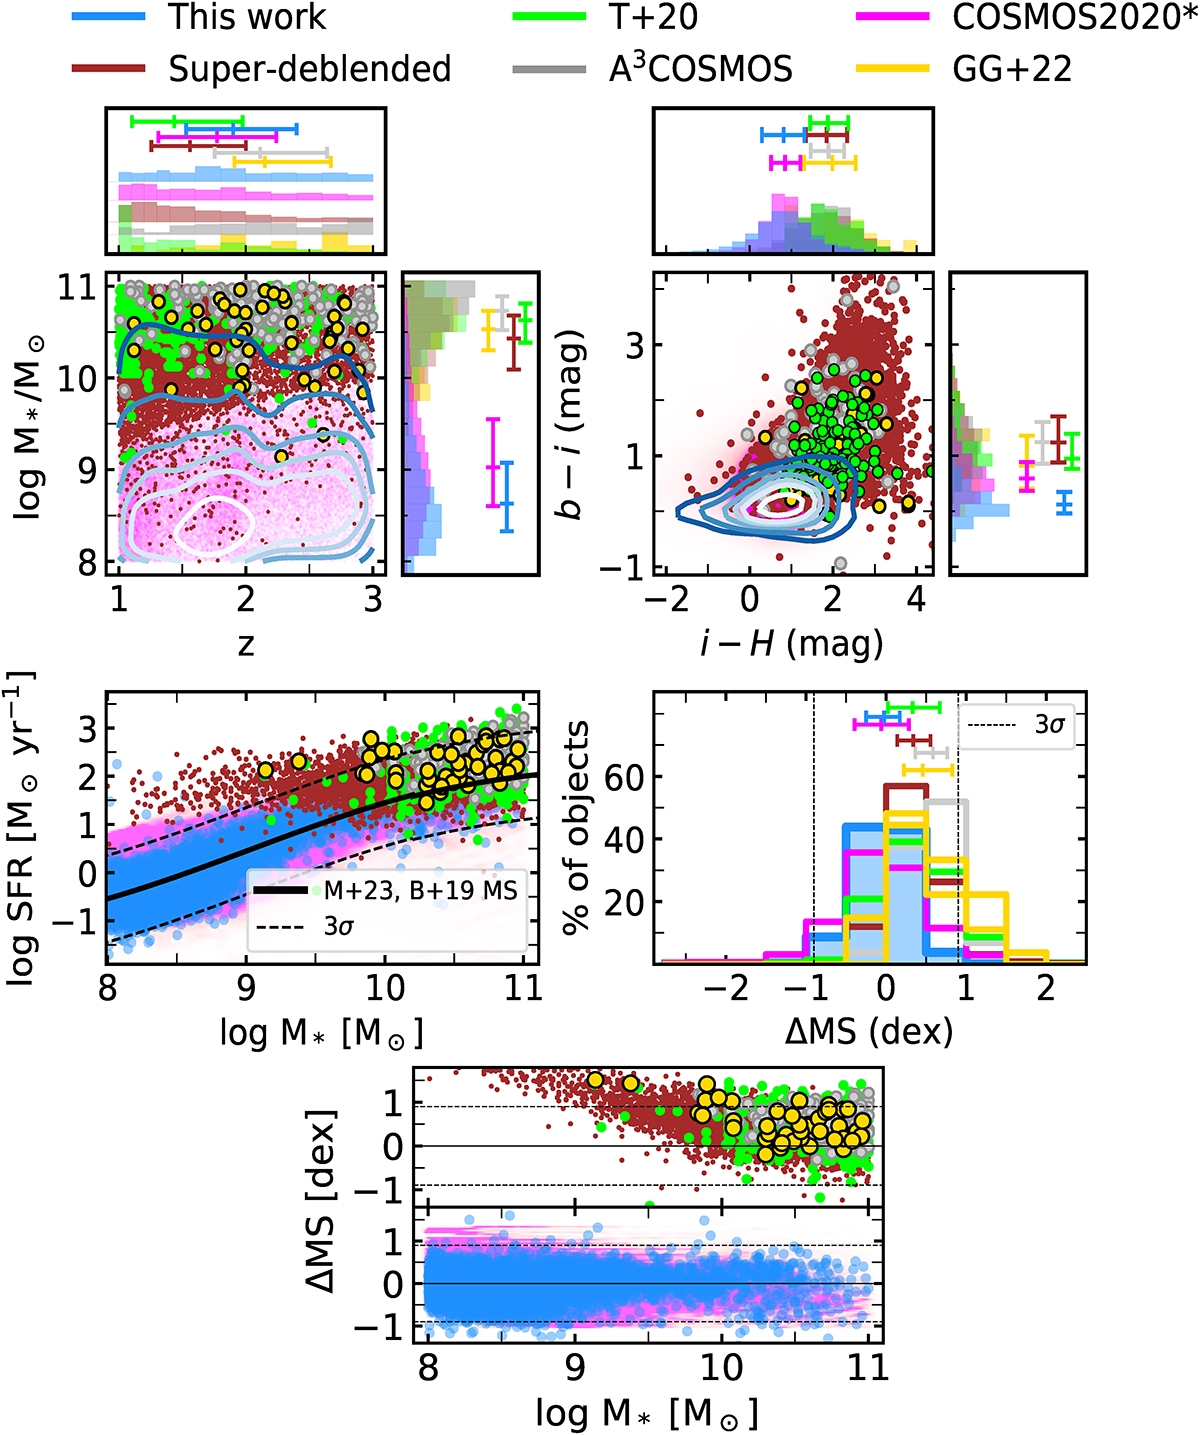
Fig. 2.
Download original image
Stellar mass vs. redshift, a color vs. color diagram based on i − H and b − i, star formation rate versus stellar mass, histograms showing the distance to the main sequence in log scale, ΔMS, and ΔMS versus stellar mass (shown from left to right and up and down). We cut the comparison samples to only include galaxies within 1.0 < z < 3.0 and having 108 − 11 M⊙. In blue, we represent our sample. The GG22 galaxies are identified in yellow. The Tacconi et al. (2020) and A3COSMOS samples are shown in gray and green, respectively. The COSMOS2020* sample is represented in magenta and the galaxies from the super-deblended catalogs are displayed in maroon. In the stellar mass vs. redshift plot, the blue contours showing our sample enclose roughly 20%, 50%, 60%, 70%, 80%, and 90% of the data. In the color-color diagram, the contours roughly enclose the 10%, 20%, 40%, 60%, 80%, and 90% of the data. In these two panels, histograms of the quantities there represented are also included, following the same color code. Quartiles are represented as horizontal segments in all the histograms. In the z-histograms shown in the first panel, we artificially elevate the baselines for the sake of clarity. The Mérida et al. (2023) MS up to 1010 M⊙ and the Barro et al. (2019) MS above 1010 M⊙ are shown in the third panel as a solid black line. The dashed lines in the third, fourth, and fifth panels show the area enclosed within 3σ with respect to the main sequence, based on the typical scatter reported in Speagle et al. (2014, ∼0.30 dex). The last panel, showing ΔMS versus the stellar mass, is split for the sake of clarity, distinguishing between the super-deblended catalogs, Tacconi et al. (2020), A3COSMOS, and GG22 (top), and our sample and COSMOS2020* (bottom). The typical uncertainties for the redshifts, stellar mass, and SFRs of our galaxies are small, ∼0.11, 0.07 dex, and 0.05 dex, respectively. In the case of the i − H and b − i colors, these are 0.14 mag and 0.20 mag, respectively.
Current usage metrics show cumulative count of Article Views (full-text article views including HTML views, PDF and ePub downloads, according to the available data) and Abstracts Views on Vision4Press platform.
Data correspond to usage on the plateform after 2015. The current usage metrics is available 48-96 hours after online publication and is updated daily on week days.
Initial download of the metrics may take a while.