Open Access
Fig. 3
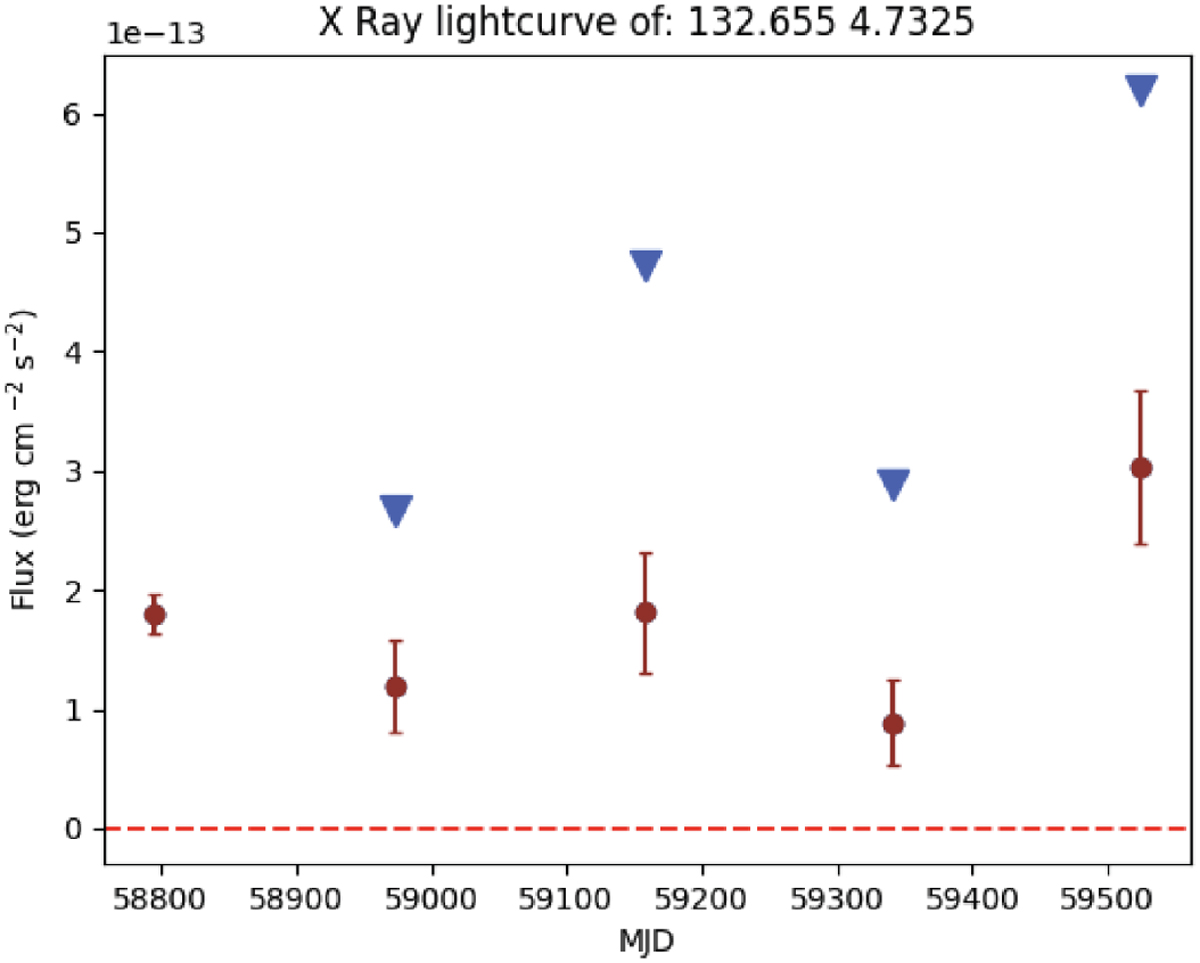
Download original image
eROSITA X-ray light curve (0.2–2.3 keV) of the polar J0850+0443 combining eFEDS (first data point) with eRASS1 to eRASS4. Blue arrows indicate the upper limit fluxes at the given position (see Tubín-Arenas et al. 2024, for details of the eROSITA upper limit concept).
Current usage metrics show cumulative count of Article Views (full-text article views including HTML views, PDF and ePub downloads, according to the available data) and Abstracts Views on Vision4Press platform.
Data correspond to usage on the plateform after 2015. The current usage metrics is available 48-96 hours after online publication and is updated daily on week days.
Initial download of the metrics may take a while.