Fig. 7.
Download original image
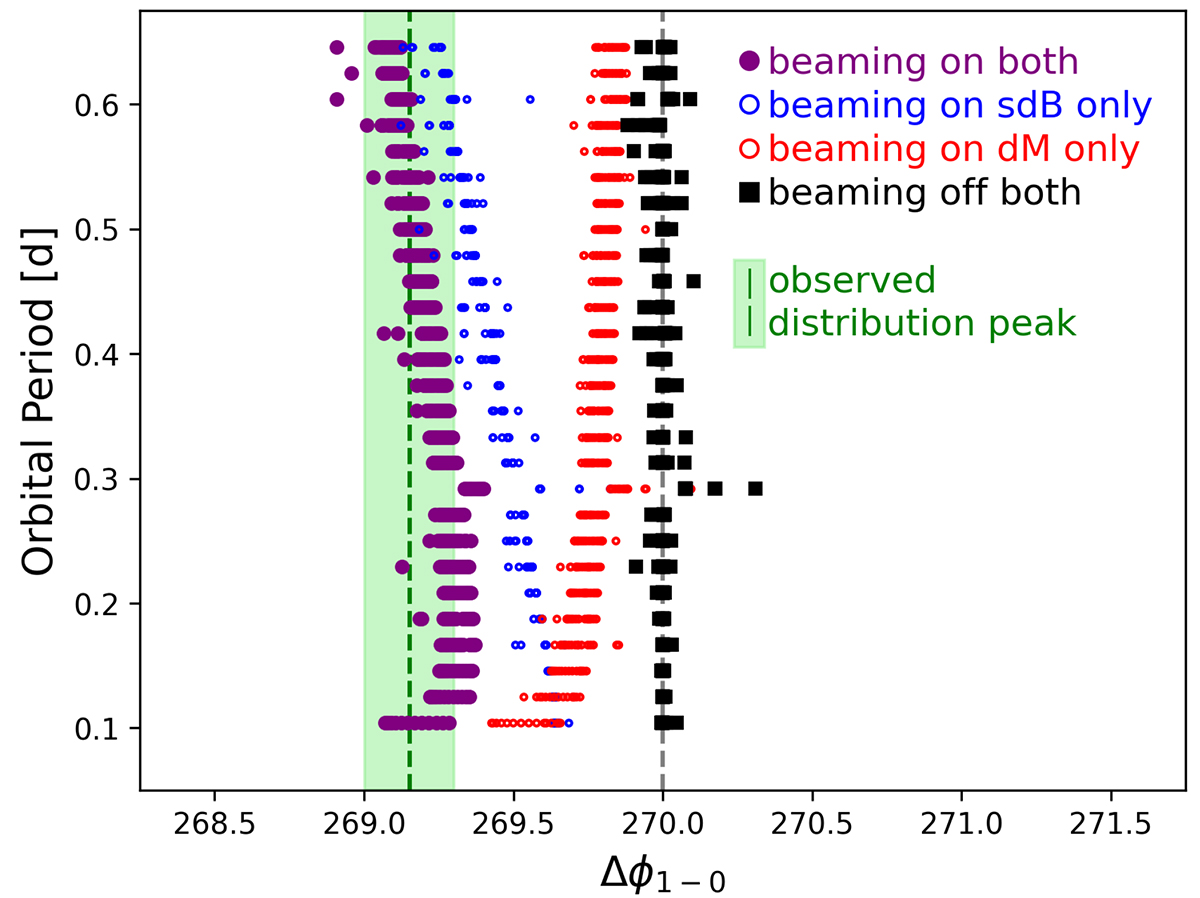
Same as the top panel of Fig. 5, but for synthetic data from lcurve. Results are shown for four sets of light curves: relativistic beaming turned off for both stars (black squares), beaming turned on for the cool companion only (red open circles), beaming turned on for the hot subdwarf only (blue open circles), and beaming turned on for both stars (purple filled circles). The dashed gray line marks 270° (symmetric shape) while the dashed green line and shaded region mark the peak of the empirical Δϕ1 − 0 distribution and its uncertainty.
Current usage metrics show cumulative count of Article Views (full-text article views including HTML views, PDF and ePub downloads, according to the available data) and Abstracts Views on Vision4Press platform.
Data correspond to usage on the plateform after 2015. The current usage metrics is available 48-96 hours after online publication and is updated daily on week days.
Initial download of the metrics may take a while.