Fig. 3.
Download original image
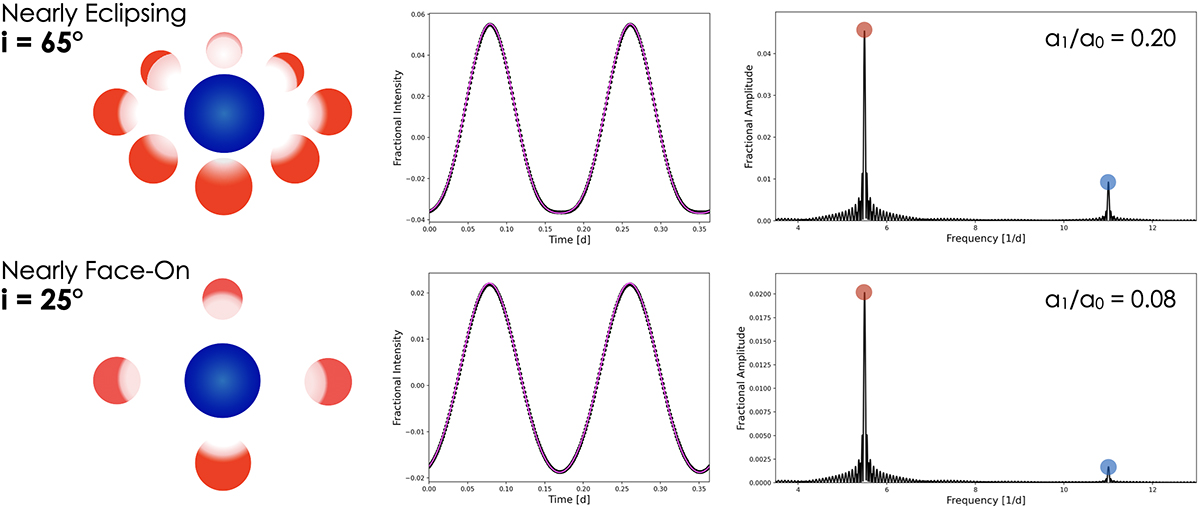
Illustration of the effect inclination has on the reflection effect shape for high–inclination (first row) and low–inclination sdB+dM/BD binaries from lcurve. Simple schematics representing the change in the reflection effect visibility along our line–of–sight (first column) are shown next to the resulting light curves (middle column) and their periodograms (right column). The schematic, which is presented in the reference frame of the hot subdwarf, is not to scale and for qualitative purposes only.
Current usage metrics show cumulative count of Article Views (full-text article views including HTML views, PDF and ePub downloads, according to the available data) and Abstracts Views on Vision4Press platform.
Data correspond to usage on the plateform after 2015. The current usage metrics is available 48-96 hours after online publication and is updated daily on week days.
Initial download of the metrics may take a while.