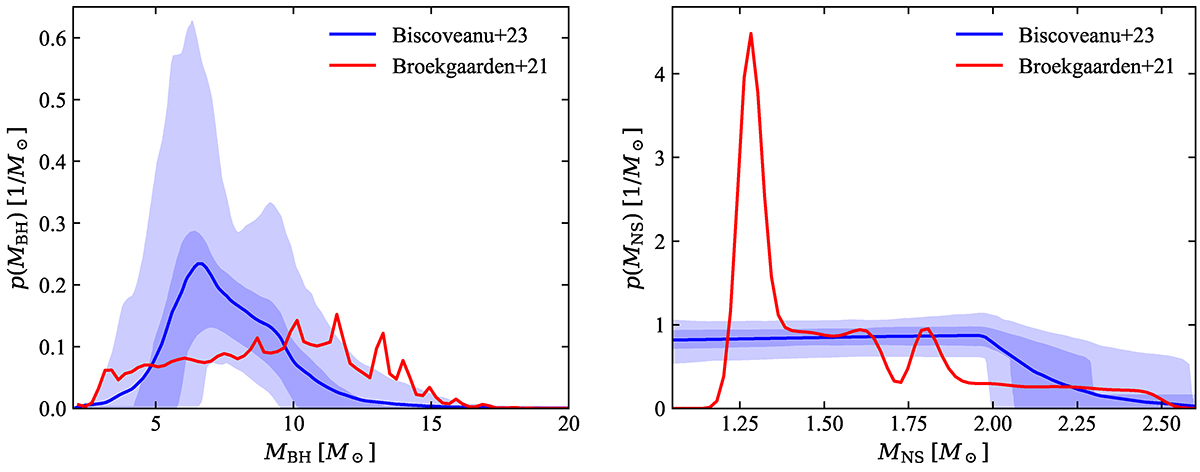
Fig. A.1.
Download original image
Component mass probability distribution comparisons. Component masses (left panel: BH; right panel: NS) probability distribution (red lines) for the fiducial model in Broekgaarden et al. (2021) used in this work and posterior predictive distributions (solid blue), 50% and 90% credible intervals (shaded blue) inferred from the population of four candidate BHNS events detected in GW with a FAR rate ≤1 yr−1 (Biscoveanu et al. 2023).
Current usage metrics show cumulative count of Article Views (full-text article views including HTML views, PDF and ePub downloads, according to the available data) and Abstracts Views on Vision4Press platform.
Data correspond to usage on the plateform after 2015. The current usage metrics is available 48-96 hours after online publication and is updated daily on week days.
Initial download of the metrics may take a while.