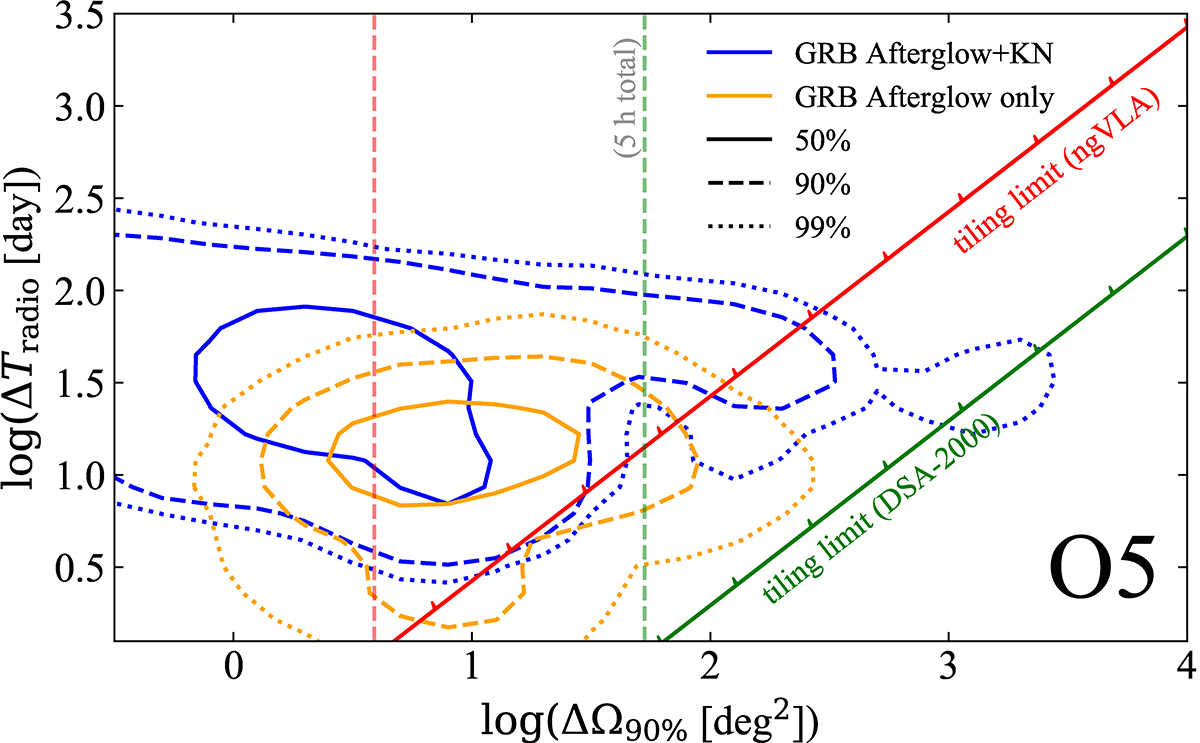
Fig. 7.
Download original image
Population contours of the GW-detectable events in O5 with detectable radio afterglow in the plane of detectability interval of the afterglow versus 90%-confidence GW sky map size. We distinguish the events with a detectable (blue) or undetectable (orange) KN. The limiting fluxes and magnitudes for the radio afterglows and KN are as in Table 2. The green and red lines indicate the limit above which the tiling strategy is viable for the DSA-2000 and the ngVLA, respectively. That is, the GW sky map can be covered at least 5 times by tiles over the afterglow time of observability (Eq. (3)). The vertical lines indicate the GW sky map sizes that require a total observing time of one and five hours to cover by the two instruments, using the same color code.
Current usage metrics show cumulative count of Article Views (full-text article views including HTML views, PDF and ePub downloads, according to the available data) and Abstracts Views on Vision4Press platform.
Data correspond to usage on the plateform after 2015. The current usage metrics is available 48-96 hours after online publication and is updated daily on week days.
Initial download of the metrics may take a while.