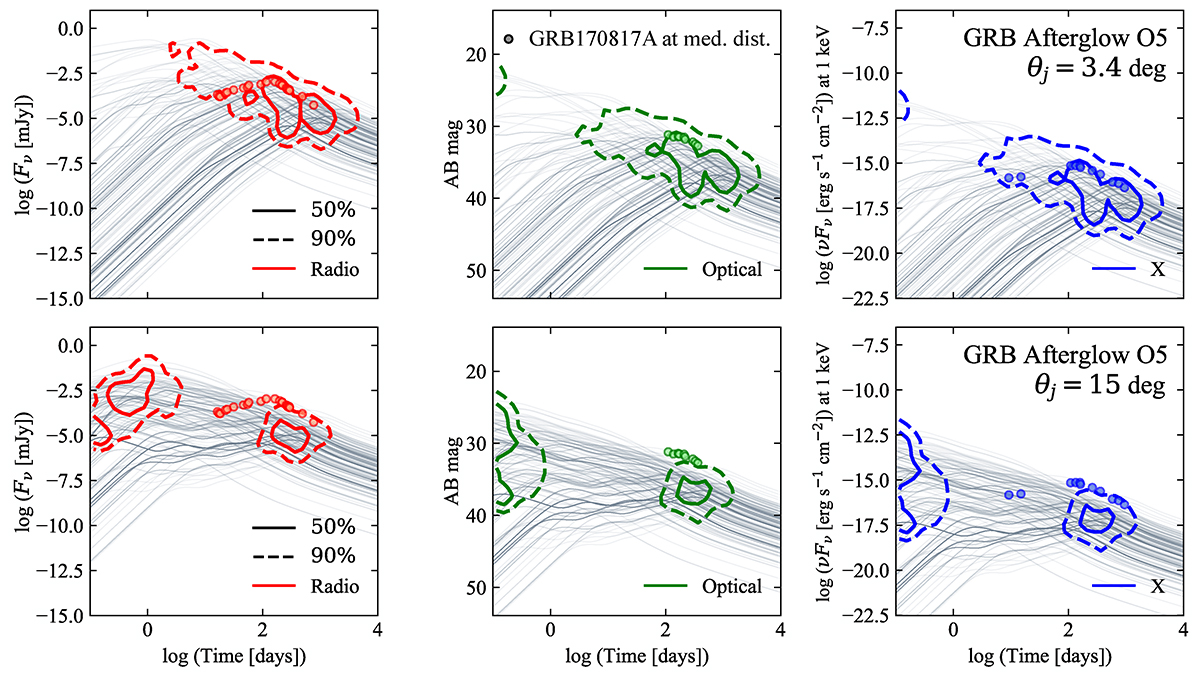
Fig. 5.
Download original image
Fν, AB magnitude, and νFν versus time for the GRB afterglow light curves associated with O5-detectable sources in our population. In the top panel we assume a jet core half-opening angle θj = 3.4°: in the lower panel we assume θj = 15°. Solid and dashed contours contain 50% and 90% of the peaks, respectively. Red, green and blue colors indicate the radio (1.4 × 10⁹ Hz), optical (4.8 × 10¹⁴ Hz), X-ray (2.4 × 10¹⁷ Hz) bands, respectively. The colored circles are the observed data of GRB170817A (Makhathini et al. 2021) at the median distance of the GW triggers. The gray lines in the background are 300 randomly sampled light curves in the respective bands.
Current usage metrics show cumulative count of Article Views (full-text article views including HTML views, PDF and ePub downloads, according to the available data) and Abstracts Views on Vision4Press platform.
Data correspond to usage on the plateform after 2015. The current usage metrics is available 48-96 hours after online publication and is updated daily on week days.
Initial download of the metrics may take a while.