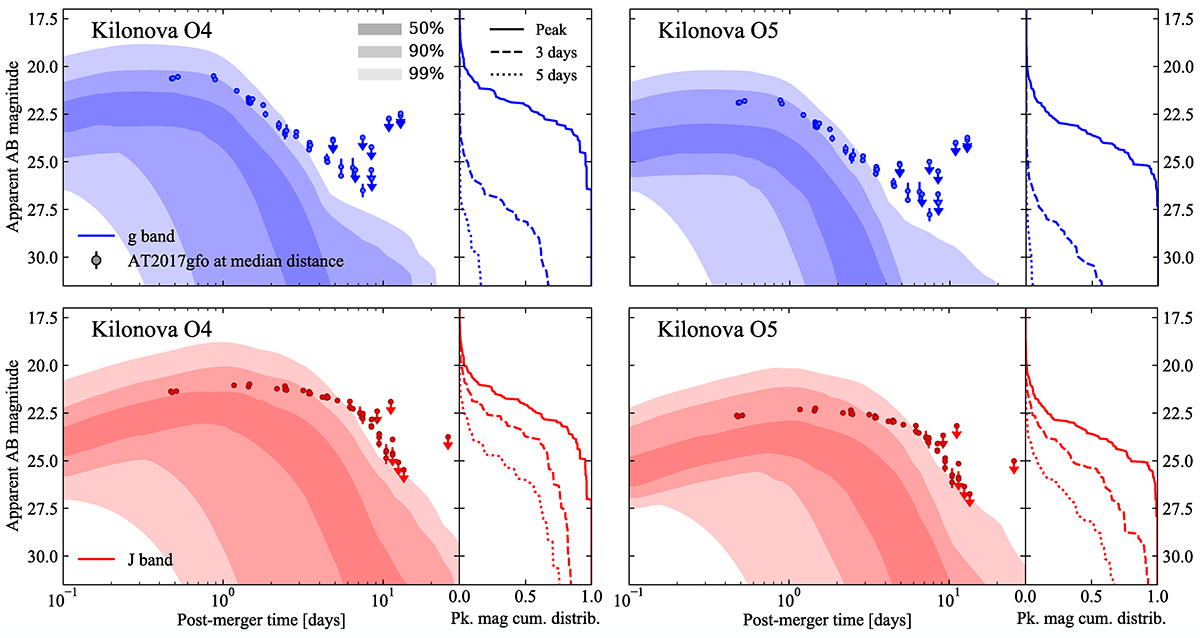
Fig. 4.
Download original image
Distribution of O4 (left-hand panel) and O5 (right-hand panel) KN g band (484 nm, upper panel in blue) and J band (1250 nm, lower panel in red) magnitudes as a function of time. The shaded regions show the apparent AB magnitude versus post-merger time for 50%, 90%, and 99% of our simulated KN light curves GW-detectable sources. Colored circles show extinction-corrected AT2017gfo data rescaled to the median distance of the GW triggers (∼212 Mpc in O4, ∼381 Mpc in O5). The solid, dashed and dotted lines show the cumulative distributions of apparent magnitude at peak, at 3 days and at 5 days after the merger, respectively.
Current usage metrics show cumulative count of Article Views (full-text article views including HTML views, PDF and ePub downloads, according to the available data) and Abstracts Views on Vision4Press platform.
Data correspond to usage on the plateform after 2015. The current usage metrics is available 48-96 hours after online publication and is updated daily on week days.
Initial download of the metrics may take a while.