Fig. 3.
Download original image
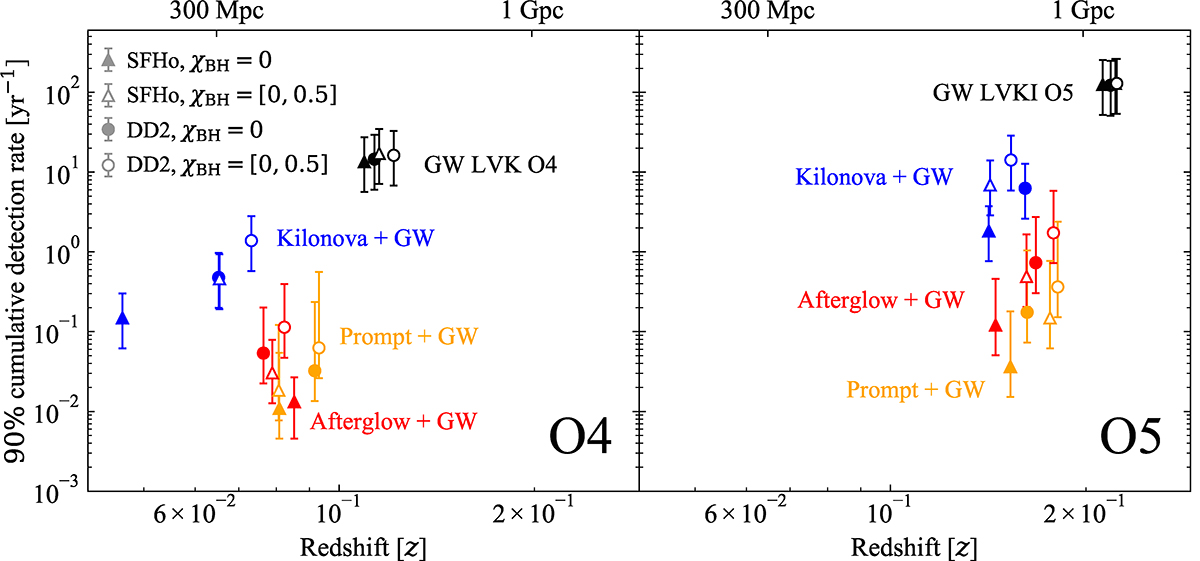
Predicted 90th percentile of the cumulative MM detection rates for our four population model variations, assuming a jet core half-opening angle θj = 3.4° for the jet-related emissions. Different marker shapes indicate different adopted EoSs (triangle: SFHo; circle: DD2). Filled markers are for χBH = 0, while empty markers are for a uniform spin parameter distribution between 0 and 0.5. The error bars indicate the uncertainty on the local merger rate. For GRB afterglow and prompt they also take into account a variation on the jet core half-opening angle (θj = 15°, corresponding to the minimum and maximum value reported in Table 1). Similarly as in Fig. 2, the left-hand panel assumes an LVK GW-detector network and the O4 projected sensitivities, while the right-hand panel assumes an LVKI network and the O5 sensitivities. EM bands and detection thresholds are the same as in Fig. 2.
Current usage metrics show cumulative count of Article Views (full-text article views including HTML views, PDF and ePub downloads, according to the available data) and Abstracts Views on Vision4Press platform.
Data correspond to usage on the plateform after 2015. The current usage metrics is available 48-96 hours after online publication and is updated daily on week days.
Initial download of the metrics may take a while.