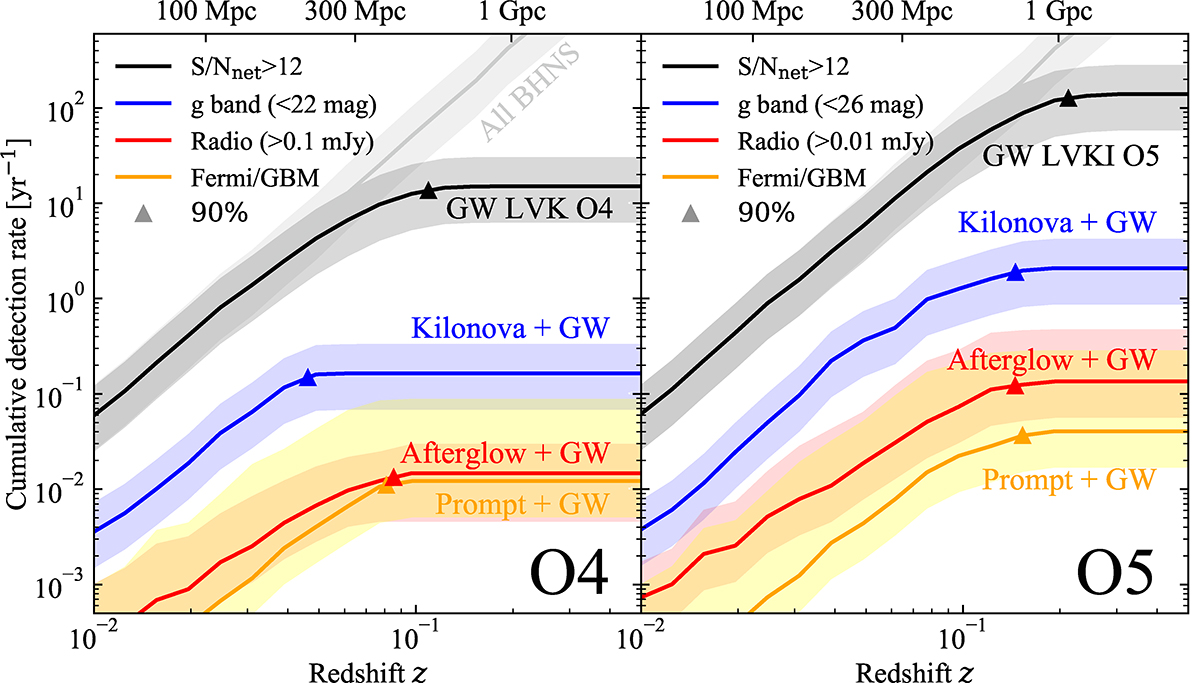
Fig. 2.
Download original image
Cumulative MM detection rates as a function of redshift (luminosity distance) for our fiducial BHNS population (SFHo EoS, non-spinning BHs) and assuming a jet core half-opening angle θj = 3.4° for the jet-related emissions. Triangles indicate the 90th percentile of the cumulative detection rate (Fig. 3 shows how this is affected when varying our assumptions). Left-hand panel: assumes the LVK network configuration and the O4 projected sensitivities. The light gray line (“All BHNS”) represents the intrinsic merger rate, with the gray band showing its uncertainty drawn from that on the local merger rate. This uncertainty propagates as a constant relative error contribution to all the other rates shown in the figure. The error region for the jet-related emissions takes also into account a possible larger core half-opening angle θj = 15°. The black (“GW LVK O4”) line is the cumulative GW detection rate (events per year with network S/N ≥ 12) in O4. The blue (“Kilonova+GW”), red (“Afterglow+GW”) and orange (“Prompt+GW”) lines are the cumulative detection rates for the joint detection of GW plus either a KN, a GRB afterglow or a GRB prompt in O4 (all-sky except for the orange line, which accounts for the Fermi/GBM duty cycle and field of view). The assumed thresholds are shown in the legend. Right-hand panel: similar to the left-hand panel, but assuming an LVKI GW detector network with the O5 projected sensitivities, and deeper EM detection thresholds (see text).
Current usage metrics show cumulative count of Article Views (full-text article views including HTML views, PDF and ePub downloads, according to the available data) and Abstracts Views on Vision4Press platform.
Data correspond to usage on the plateform after 2015. The current usage metrics is available 48-96 hours after online publication and is updated daily on week days.
Initial download of the metrics may take a while.