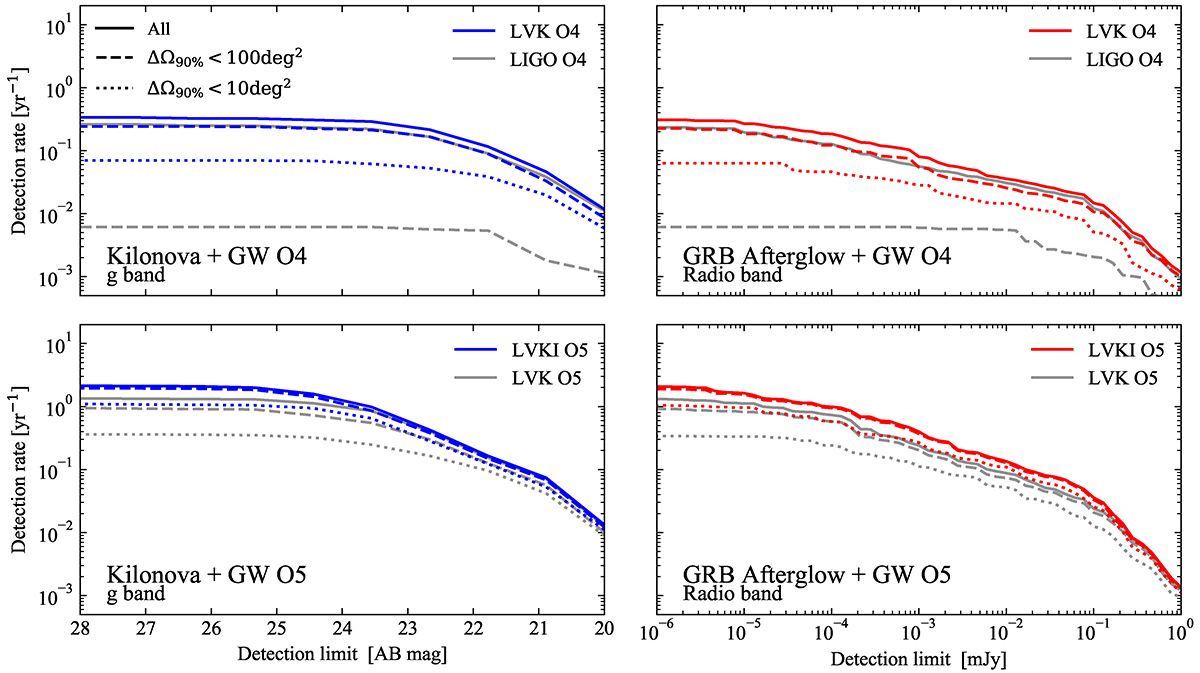
Fig. C.2.
Download original image
Detection rate as a function of detection limit threshold for our fiducial BHNS population. In the top panel we assume the LVK O4 detectors network (colored lines) and a network consisting of only two aLIGO (gray lines). In the lower panel we assume the LVKI O5 detectors network (colored lines) and the same network without LIGO–India (black lines). Every network is assumed with a 70% duty cycle for each detector. The blue and red colors indicate respectively the kilonova+GW (g band) and the GRB afterglow+GW (radio band) detectable binaries. The solid line indicates all the detectable binaries, the dashed and dotted lines the detectable binaries with ΔΩ90% < 100 deg2 and the ones with ΔΩ90% < 10 deg2, respectively.
Current usage metrics show cumulative count of Article Views (full-text article views including HTML views, PDF and ePub downloads, according to the available data) and Abstracts Views on Vision4Press platform.
Data correspond to usage on the plateform after 2015. The current usage metrics is available 48-96 hours after online publication and is updated daily on week days.
Initial download of the metrics may take a while.