Fig. C.1.
Download original image
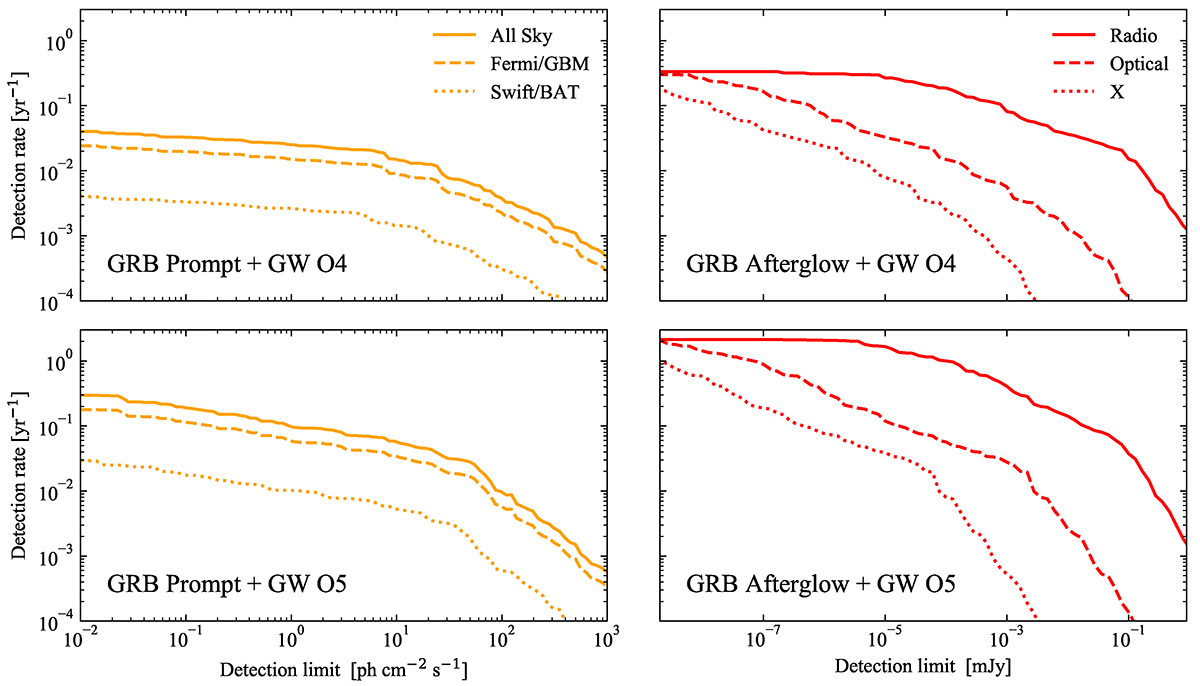
Detection rate as a function of detection limit threshold for our fiducial BHNS population. In the top panel we assume the LVK O4 detectors network, while in the lower panel we assume the LVKI O5 detectors, both with a 70% duty cycle for each detector. The orange and red colors indicate respectively the GRB prompt+GW and the GRB afterglow+GW detectable binaries. In the left panel, the solid line indicates an all-sky field of view with a 100% duty cycle, the dashed and dotted lines account for the Fermi/GBM and Swift/BAT duty cycle and field of view, respectively. In the right panel, the solid, dashed, and dotted lines indicate the radio, optical, and X bands, respectively.
Current usage metrics show cumulative count of Article Views (full-text article views including HTML views, PDF and ePub downloads, according to the available data) and Abstracts Views on Vision4Press platform.
Data correspond to usage on the plateform after 2015. The current usage metrics is available 48-96 hours after online publication and is updated daily on week days.
Initial download of the metrics may take a while.