Fig. 9
Download original image
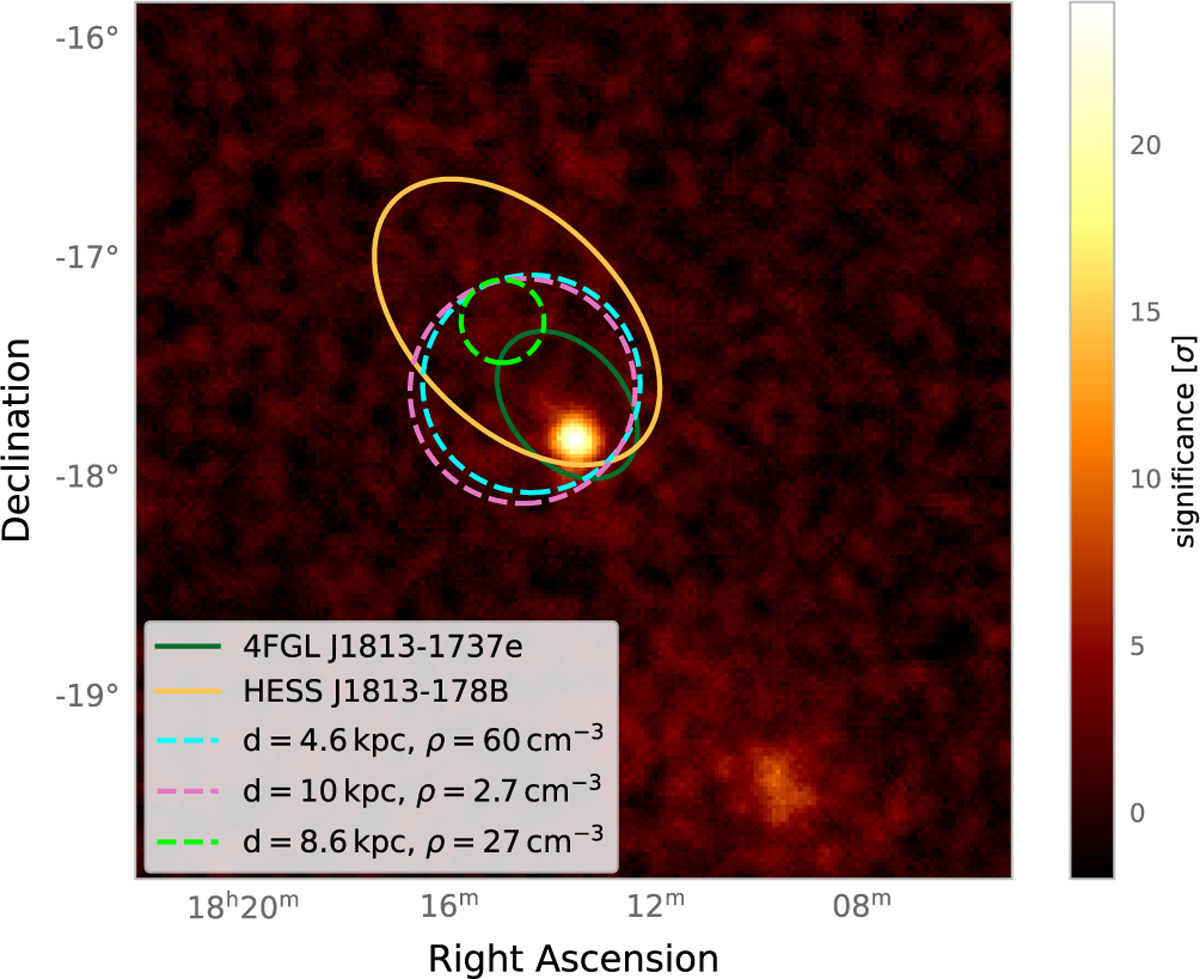
Significance map computed from the H.E.S.S data with an correlation radius of 0.06°. The estimated position and density of molecular clouds in the region are indicated by the dashed lines. Additionally, the morphology of the best-fit model derived in the analysis of the Fermi-LAT and H.E.S.S. data is indicated. Only clouds with a distance between 4 kpc and 12 kpc and a large positional overlap with the extended emission observed in Fermi-LAT and H.E.S.S. are depicted in the counts map.
Current usage metrics show cumulative count of Article Views (full-text article views including HTML views, PDF and ePub downloads, according to the available data) and Abstracts Views on Vision4Press platform.
Data correspond to usage on the plateform after 2015. The current usage metrics is available 48-96 hours after online publication and is updated daily on week days.
Initial download of the metrics may take a while.