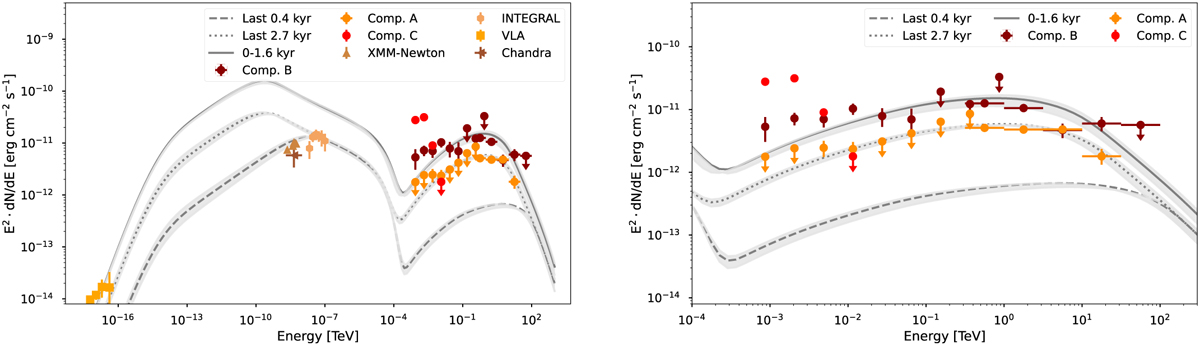
Fig. 7
Download original image
SED derived in this analysis, as well as X-ray SED by XMM-Newton (Funk et al. 2007), Chandra (Helfand et al. 2007), and INTEGRAL (Ubertini et al. 2005), and the SED derived in the analysis of VLA data (Brogan et al. 2005a), compared to the SED curves expected from the leptonic model obtained with GAMERA. Left: full energy range. Right: comparison between the γ ray flux estimated from the leptonic model from 0–1.6 kyrs and the last 2.5 kyrs and the emission observed from HESS J1813–178B and HESS J1813–178A respectively. The shaded grey error bands indicate the possible parameter space, given in Table 6.
Current usage metrics show cumulative count of Article Views (full-text article views including HTML views, PDF and ePub downloads, according to the available data) and Abstracts Views on Vision4Press platform.
Data correspond to usage on the plateform after 2015. The current usage metrics is available 48-96 hours after online publication and is updated daily on week days.
Initial download of the metrics may take a while.