Fig. 3
Download original image
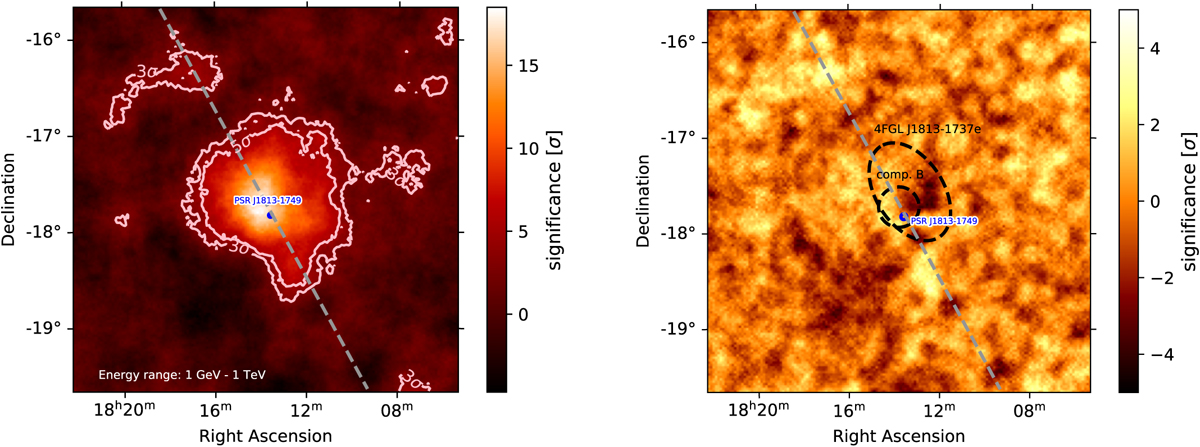
Significance maps of the Fermi-LAT data around the position of 4FGL J1813-1737e in the energy range from 1 GeV to 1 TeV, with a correlation radius of 0.1°. Left: the position of the Galactic plane is indicated by the dashed line, the pulsar position is indicated in blue, and 3σ and 5σ contours are depicted. Right: significance map of the region after subtracting the emission using an elongated Gaussian model and a symmetric Gaussian model. The 1σ Gaussian extent of the models is depicted by the black dashed lines.
Current usage metrics show cumulative count of Article Views (full-text article views including HTML views, PDF and ePub downloads, according to the available data) and Abstracts Views on Vision4Press platform.
Data correspond to usage on the plateform after 2015. The current usage metrics is available 48-96 hours after online publication and is updated daily on week days.
Initial download of the metrics may take a while.