Open Access
Fig. E.1
Download original image
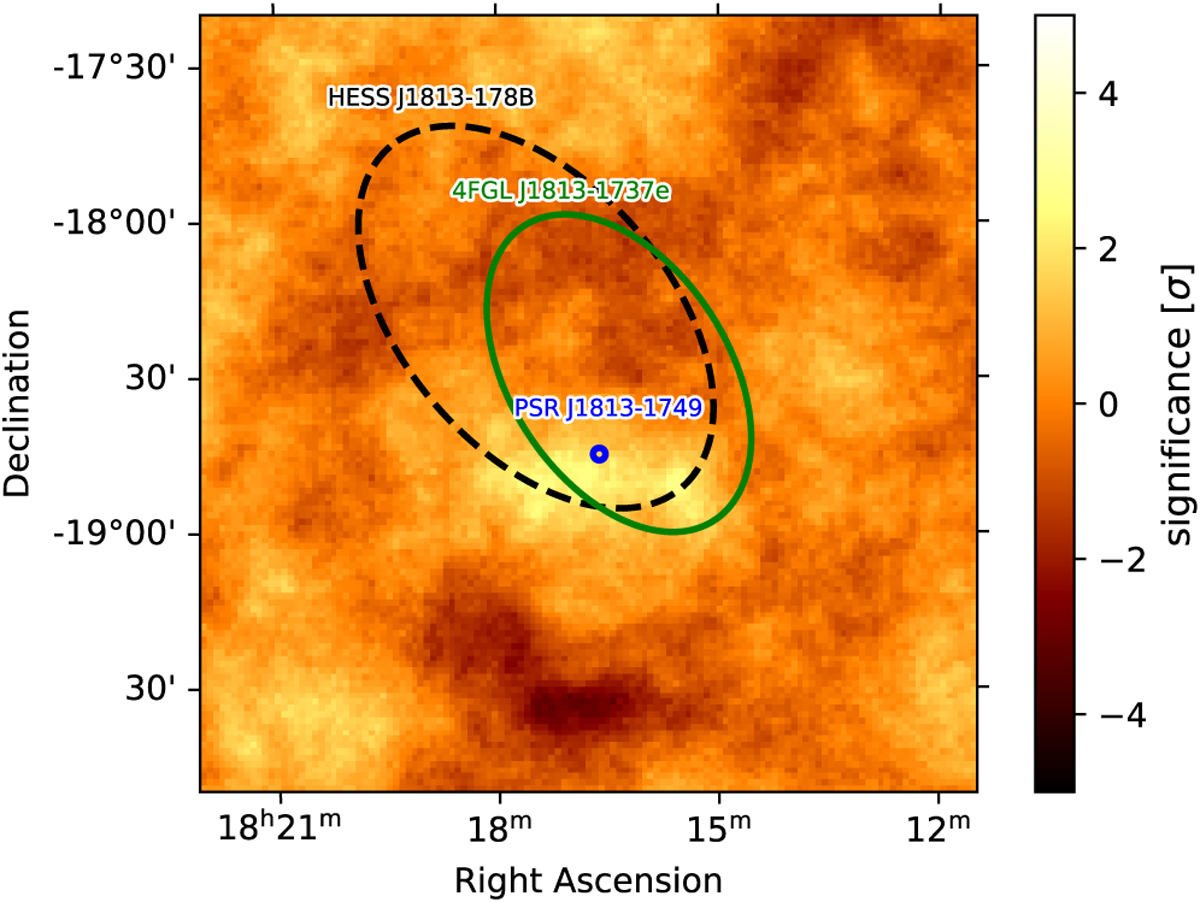
Excess map of the H.E.S.S. data after the addition of the Gaussian and elongated Gaussian model. The position of PSR J1813–1749 is indicated by the blue dot. The best-fit model describing the emission observed by H.E.S.S. is indicated by the black dashed lines. The Fermi-LAT best-fit model is depicted by the green ellipse.
Current usage metrics show cumulative count of Article Views (full-text article views including HTML views, PDF and ePub downloads, according to the available data) and Abstracts Views on Vision4Press platform.
Data correspond to usage on the plateform after 2015. The current usage metrics is available 48-96 hours after online publication and is updated daily on week days.
Initial download of the metrics may take a while.