Open Access
Fig. B.1
Download original image
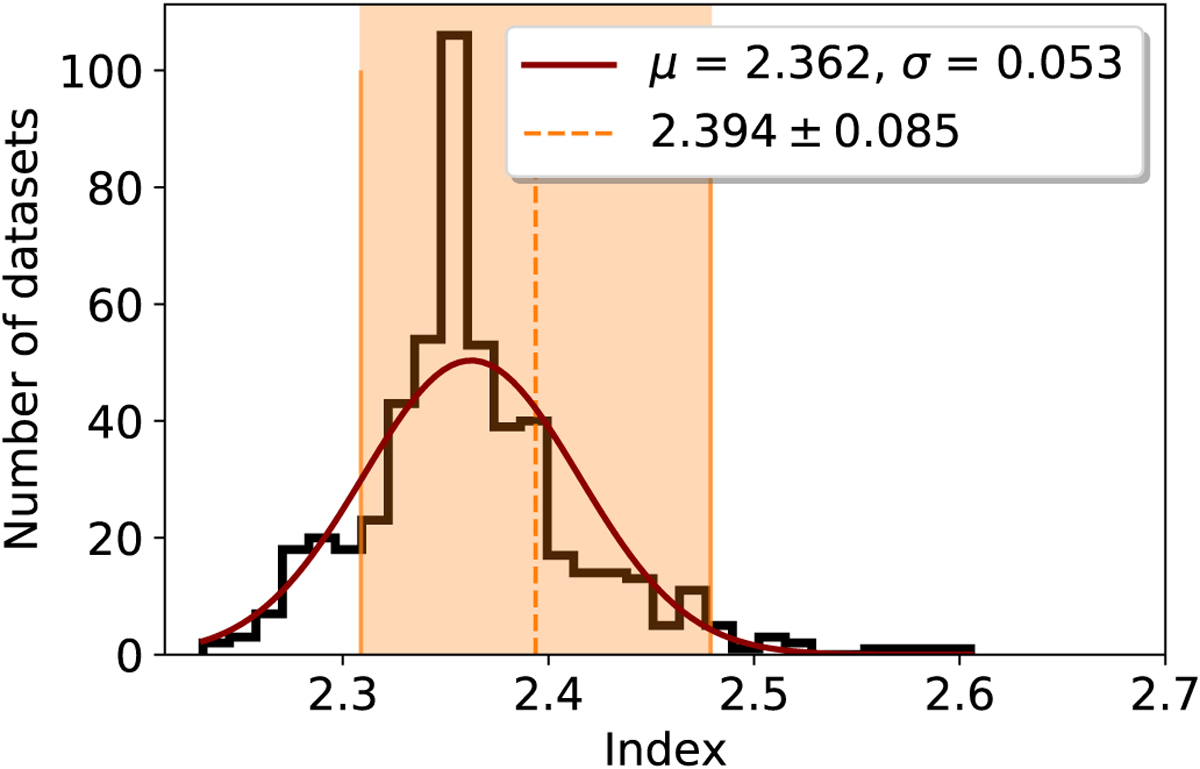
Distribution of the best-fit values of the spectral index for HESS J1813–178B. A Gaussian fit to the data is indicated in red. The orange dashed line corresponds to the fit value derived in the analysis of the original dataset, the orange band indicates the statistical error.
Current usage metrics show cumulative count of Article Views (full-text article views including HTML views, PDF and ePub downloads, according to the available data) and Abstracts Views on Vision4Press platform.
Data correspond to usage on the plateform after 2015. The current usage metrics is available 48-96 hours after online publication and is updated daily on week days.
Initial download of the metrics may take a while.