Fig. 1
Download original image
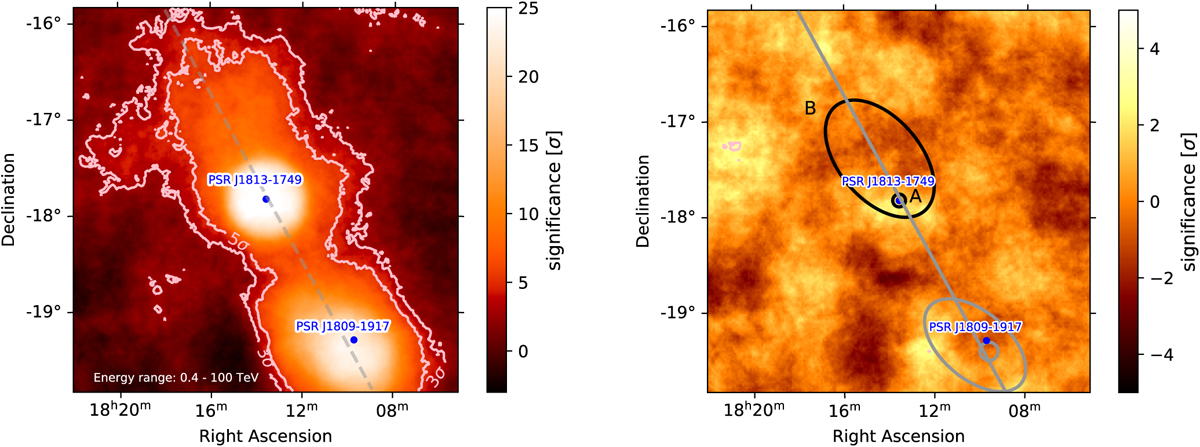
Significance maps of the data taken by H.E.S.S. in the energy range between 0.4 and 100 TeV. For both maps, a correlation radius of 0.4° was used. Left: significance map of the region around PSR J1813–1749. The contours correspond to the 3 and 5σ regions. The dashed line indicates the position of the Galactic plane. Right: significance map of the region after subtracting the emission using four components. The blue dots indicate the positions of both pulsars. The 1σ Gaussian extend of the models used to describe the emission are indicated by the grey and black lines.
Current usage metrics show cumulative count of Article Views (full-text article views including HTML views, PDF and ePub downloads, according to the available data) and Abstracts Views on Vision4Press platform.
Data correspond to usage on the plateform after 2015. The current usage metrics is available 48-96 hours after online publication and is updated daily on week days.
Initial download of the metrics may take a while.