Open Access
Fig. 10.
Download original image
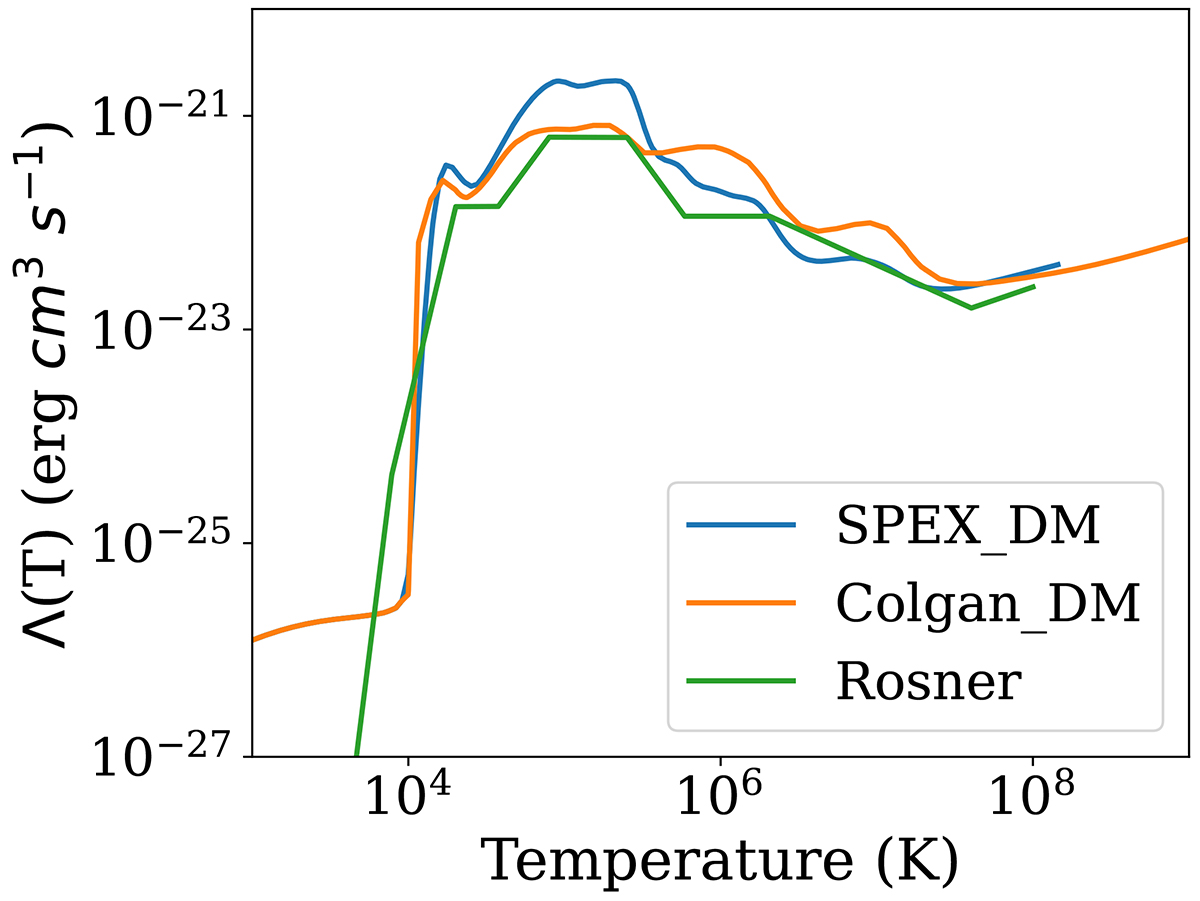
Three optically thin cooling curves used in this work. The cooling rate is plotted as a function of the temperature. The blue, orange, and green curves represent the SPEX_DM, Colgan_DM, and Rosner cooling curves, respectively.
Current usage metrics show cumulative count of Article Views (full-text article views including HTML views, PDF and ePub downloads, according to the available data) and Abstracts Views on Vision4Press platform.
Data correspond to usage on the plateform after 2015. The current usage metrics is available 48-96 hours after online publication and is updated daily on week days.
Initial download of the metrics may take a while.