Open Access
Fig. 9
Download original image
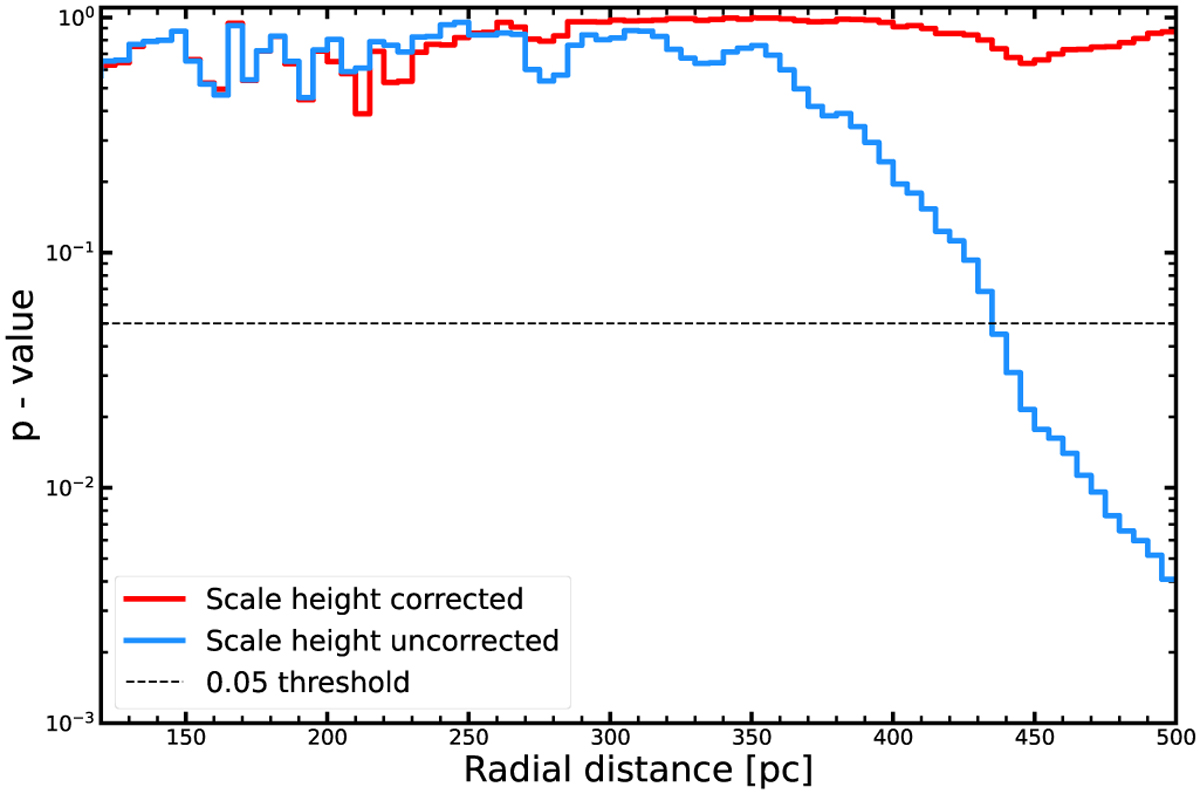
Determined p-value as a function of radial distance at 5 pc intervals from the KS test. The blue line gives the first iteration and displays a deviation from homogeneity around 350 pc, whereas the red line gives the second iteration when the scale height is taken into account and remains high, suggesting homogeneity.
Current usage metrics show cumulative count of Article Views (full-text article views including HTML views, PDF and ePub downloads, according to the available data) and Abstracts Views on Vision4Press platform.
Data correspond to usage on the plateform after 2015. The current usage metrics is available 48-96 hours after online publication and is updated daily on week days.
Initial download of the metrics may take a while.