Fig. 7
Download original image
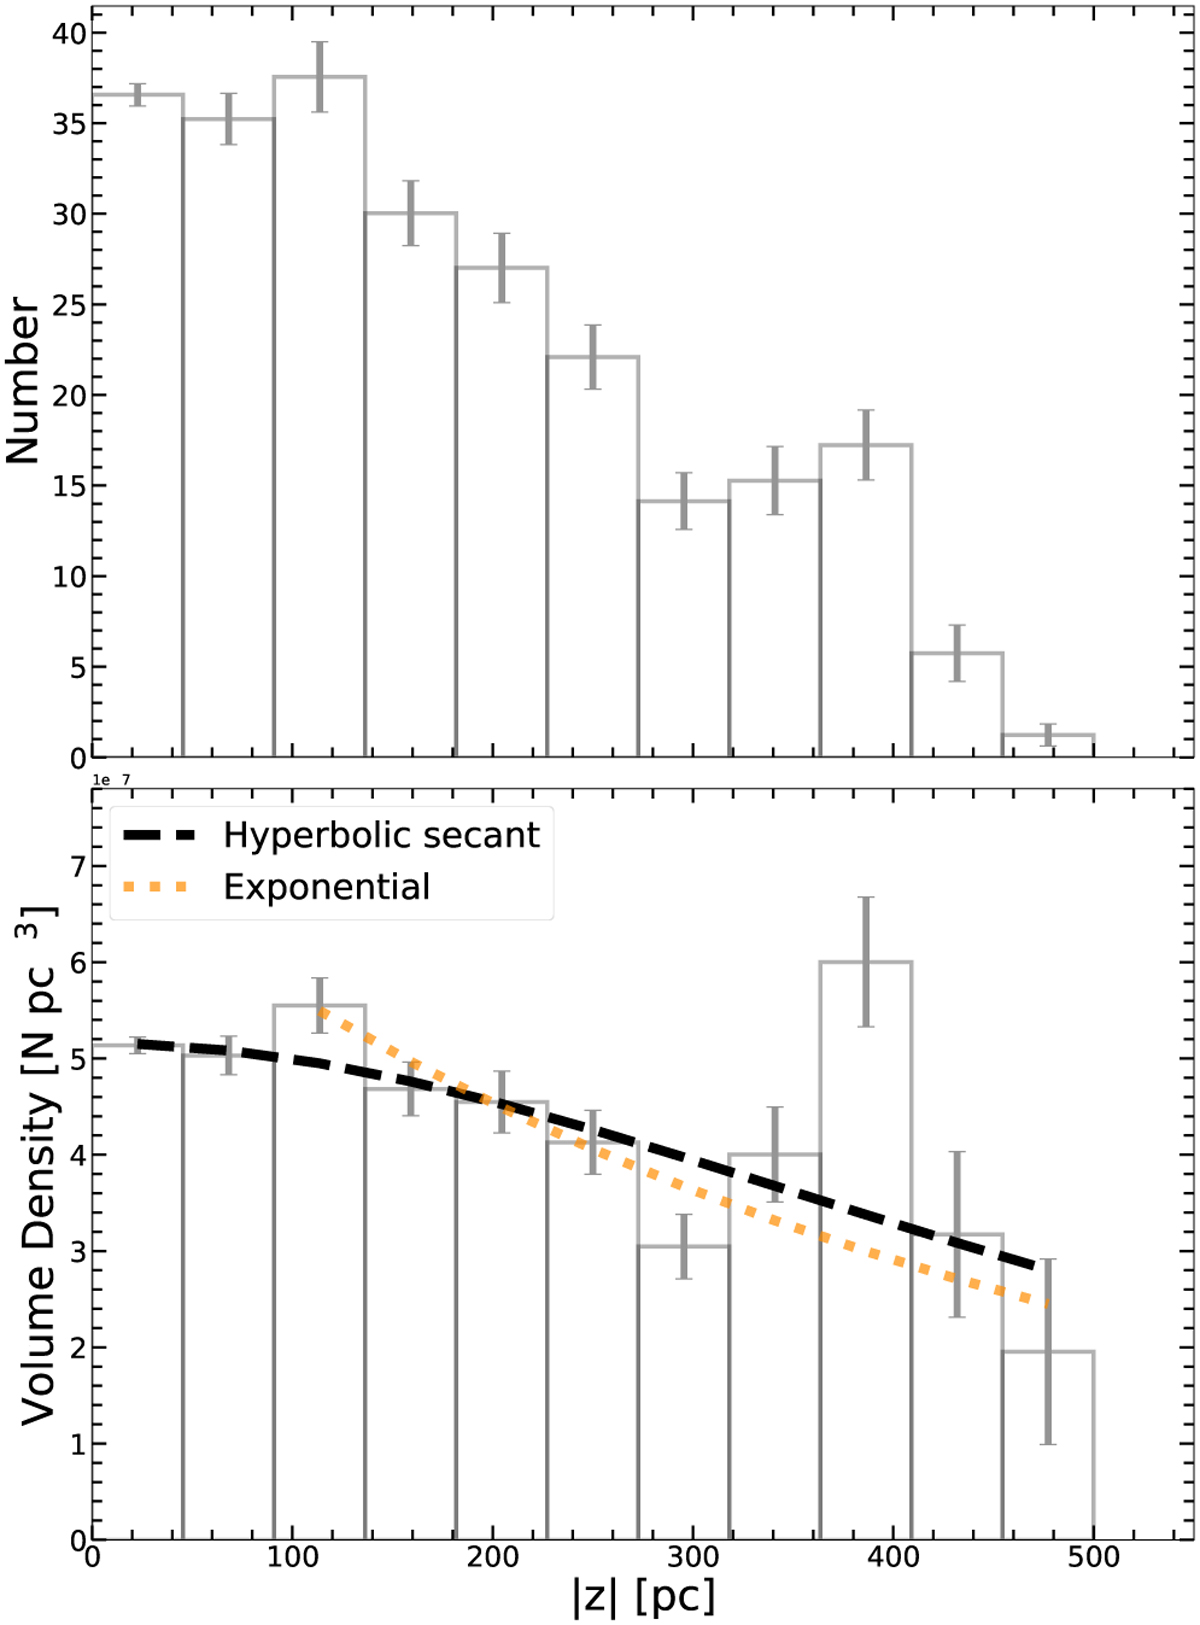
Distribution of the non-composite hot subdwarf stars over the perpendicular distance to the Galactic plane, |ɀ|. The top panel gives the number count, whereas the bottom panel displays the volume density. Median bin sizes of the fitting routine are displayed. Example fits of a hyperbolic secant profile (black) and an exponential (gold) are shown; the latter has only been fit for |ɀ| > 100 pc. The error bars are generated from the standard deviations of the positional probability distributions.
Current usage metrics show cumulative count of Article Views (full-text article views including HTML views, PDF and ePub downloads, according to the available data) and Abstracts Views on Vision4Press platform.
Data correspond to usage on the plateform after 2015. The current usage metrics is available 48-96 hours after online publication and is updated daily on week days.
Initial download of the metrics may take a while.