Fig. 6
Download original image
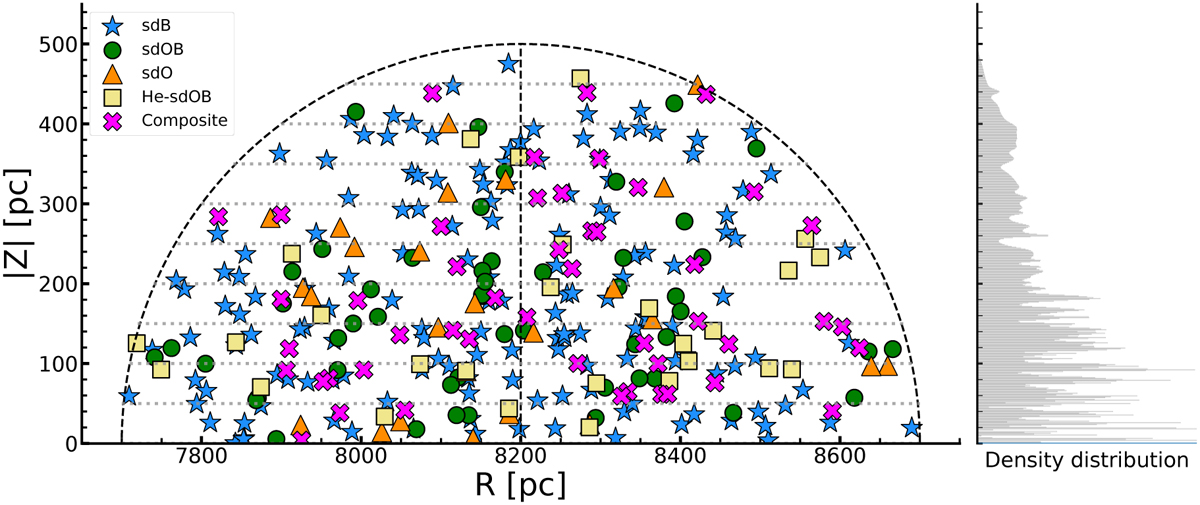
Projected distribution of the 500 pc sample above the Galactic plane. Left panel: 500 pc sample is projected onto the R-|Z| plane with the different classes of hot subdwarfs colour-coded accordingly. The black dashed line indicates the 500 pc distance limit, whereas the horizontal grey dashed lines represent a 50 pc binning example for how the sample has been divided up to derive the scale height. Right panel: positional probability density distribution projected onto the ɀ-axis taking the standard parallax errors of Gaia into account – displayed as a stacked histogram.
Current usage metrics show cumulative count of Article Views (full-text article views including HTML views, PDF and ePub downloads, according to the available data) and Abstracts Views on Vision4Press platform.
Data correspond to usage on the plateform after 2015. The current usage metrics is available 48-96 hours after online publication and is updated daily on week days.
Initial download of the metrics may take a while.