Fig. 5
Download original image
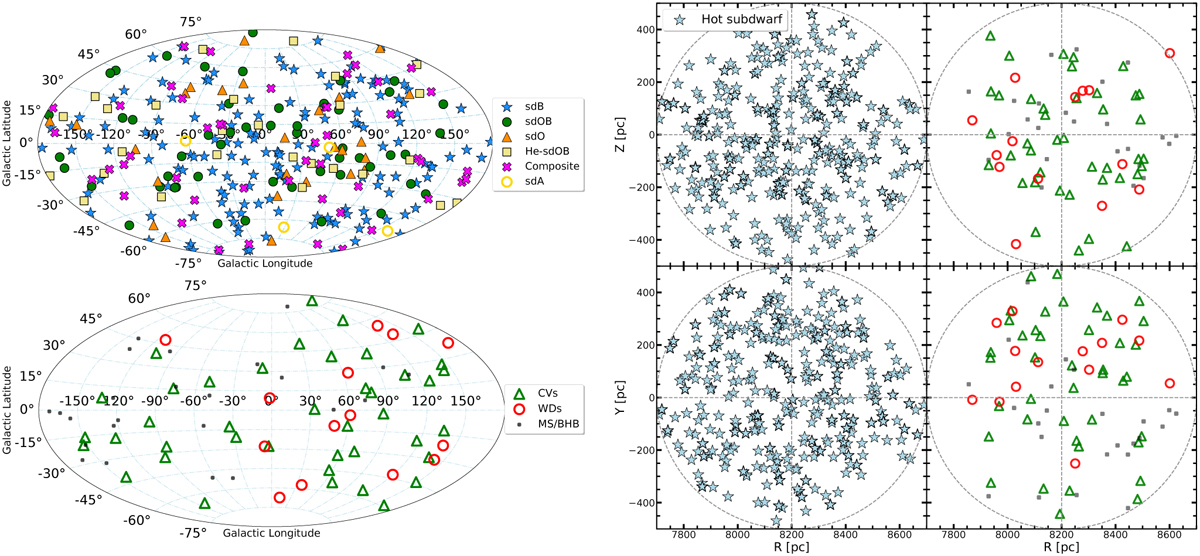
Galactic distribution of the 500 pc sample and its constituents, which are labelled accordingly for all plots. The left panel describes the projected distribution of the sample on the sky in terms of Galactic longitude and latitude, whereas the right panel gives the projected positions onto the Galactic plane (X–Y plane) and on the plane perpendicular to it (X–Z plane). Here the X-coordinate is given in terms of R, the solar distance from the Galactic centre.
Current usage metrics show cumulative count of Article Views (full-text article views including HTML views, PDF and ePub downloads, according to the available data) and Abstracts Views on Vision4Press platform.
Data correspond to usage on the plateform after 2015. The current usage metrics is available 48-96 hours after online publication and is updated daily on week days.
Initial download of the metrics may take a while.