Fig. 4
Download original image
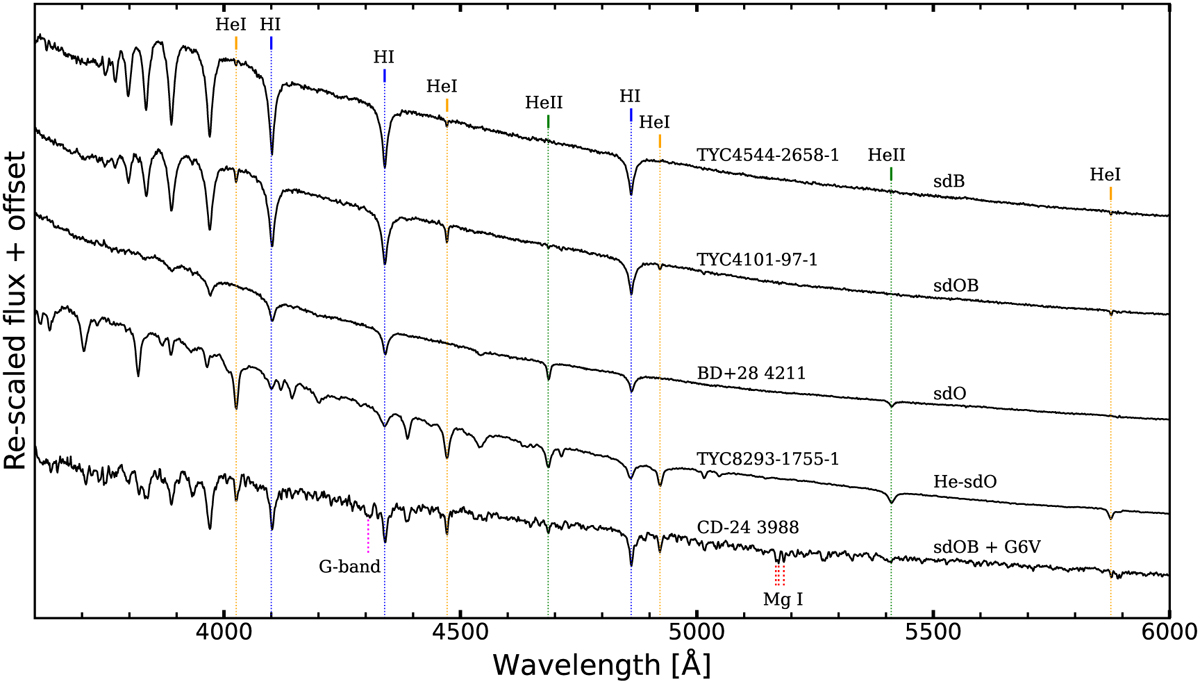
Example identification spectra obtained in this study to illustrate the adopted classification scheme and to showcase the high quality of the dataset. The primary diagnostic lines of He I, He II, H I, the Mg I triplet, and the G-band are marked in gold, green, blue, red, and magenta respectively. These spectra were obtained at the INT and at SOAR (see Table 2).
Current usage metrics show cumulative count of Article Views (full-text article views including HTML views, PDF and ePub downloads, according to the available data) and Abstracts Views on Vision4Press platform.
Data correspond to usage on the plateform after 2015. The current usage metrics is available 48-96 hours after online publication and is updated daily on week days.
Initial download of the metrics may take a while.