Fig. 3
Download original image
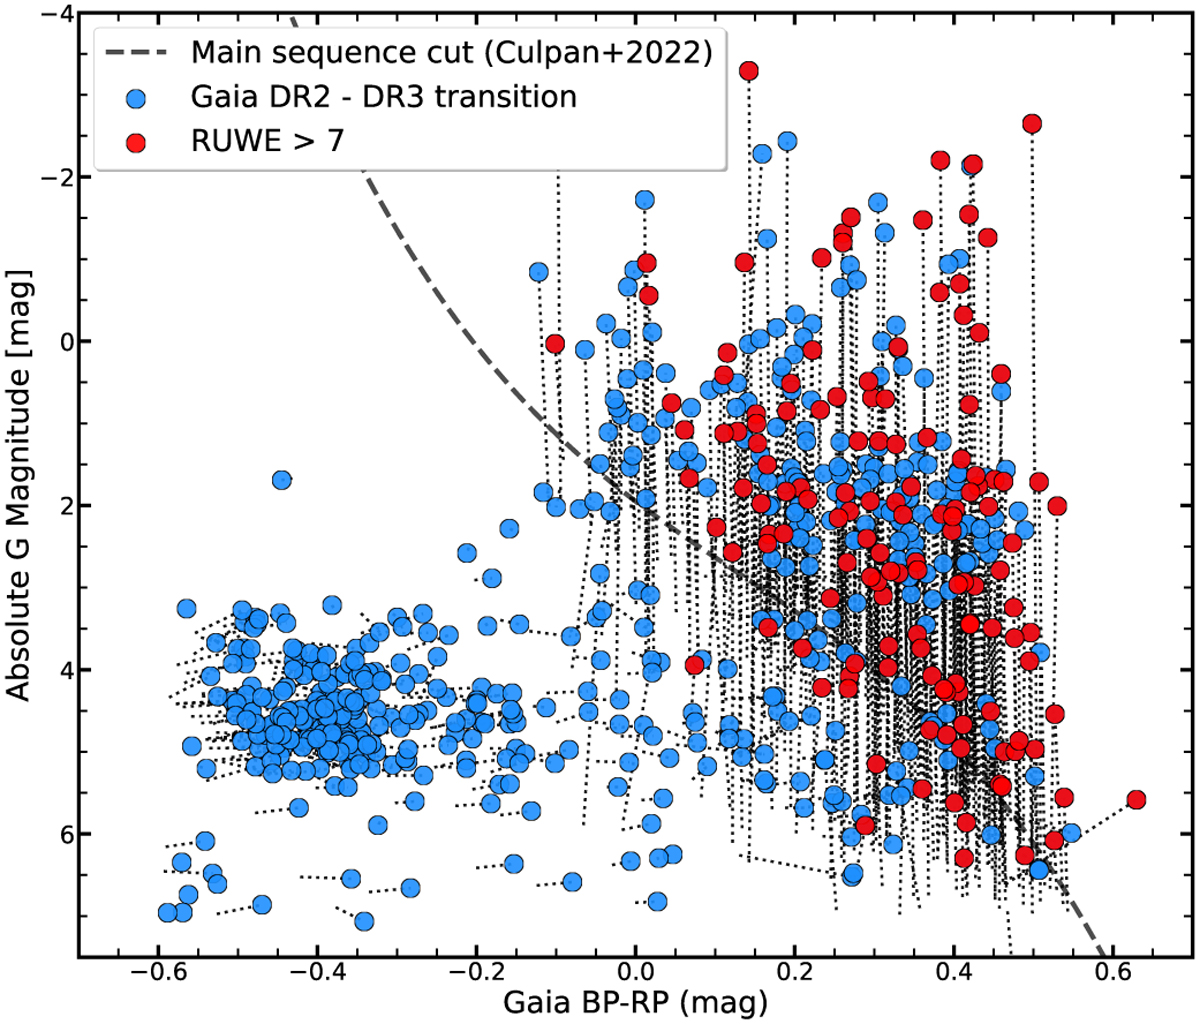
Colour-magnitude diagram of hot subluminous star candidates originally selected from Geier et al. (2019), which draws from Gaia DR2. The plot highlights the impact the updated parameters in the Gaia DR2 to Gaia DR3 transition had on the flagship 500 pc sample. The pair-plot shows the shift each star underwent after DR3 where the circle represents the DR3 data. The vertical shift near the MS stems primarily from the improved astrometric solution.
Current usage metrics show cumulative count of Article Views (full-text article views including HTML views, PDF and ePub downloads, according to the available data) and Abstracts Views on Vision4Press platform.
Data correspond to usage on the plateform after 2015. The current usage metrics is available 48-96 hours after online publication and is updated daily on week days.
Initial download of the metrics may take a while.