Fig. 14
Download original image
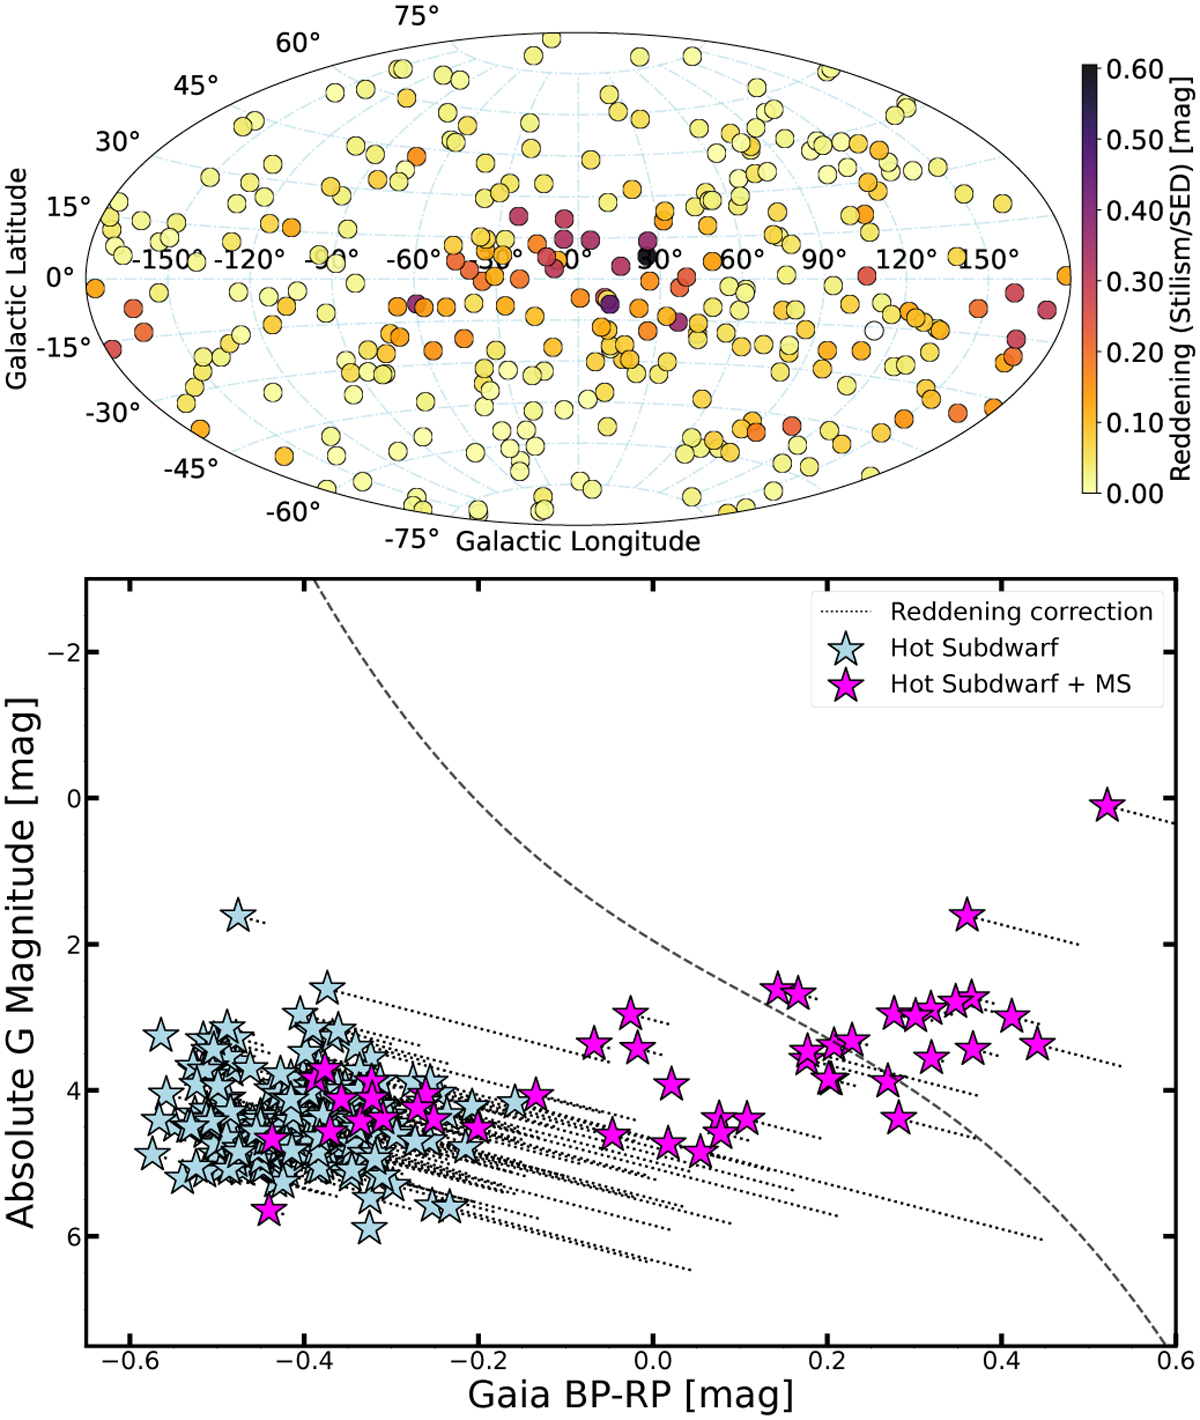
Effect of interstellar extinction on the 500 pc sample. Top: skyplot of the 500 pc sample which is colour-coded according to the reddening parameters given by both Stilism and the SED fits. Bottom: Gbp − Grp vs MG diagram of the same sources where blue stars indicate non-composite hot subdwarfs that have been corrected for interstellar extinction using the E(44–55) SED estimates, and magenta stars indicating composite-colour hot subdwarfs that have been corrected for using Stilism. The correction shift is shown with the black dotted lines. Systems hosting subgiant companions have been excluded from the plot.
Current usage metrics show cumulative count of Article Views (full-text article views including HTML views, PDF and ePub downloads, according to the available data) and Abstracts Views on Vision4Press platform.
Data correspond to usage on the plateform after 2015. The current usage metrics is available 48-96 hours after online publication and is updated daily on week days.
Initial download of the metrics may take a while.