Fig. 13
Download original image
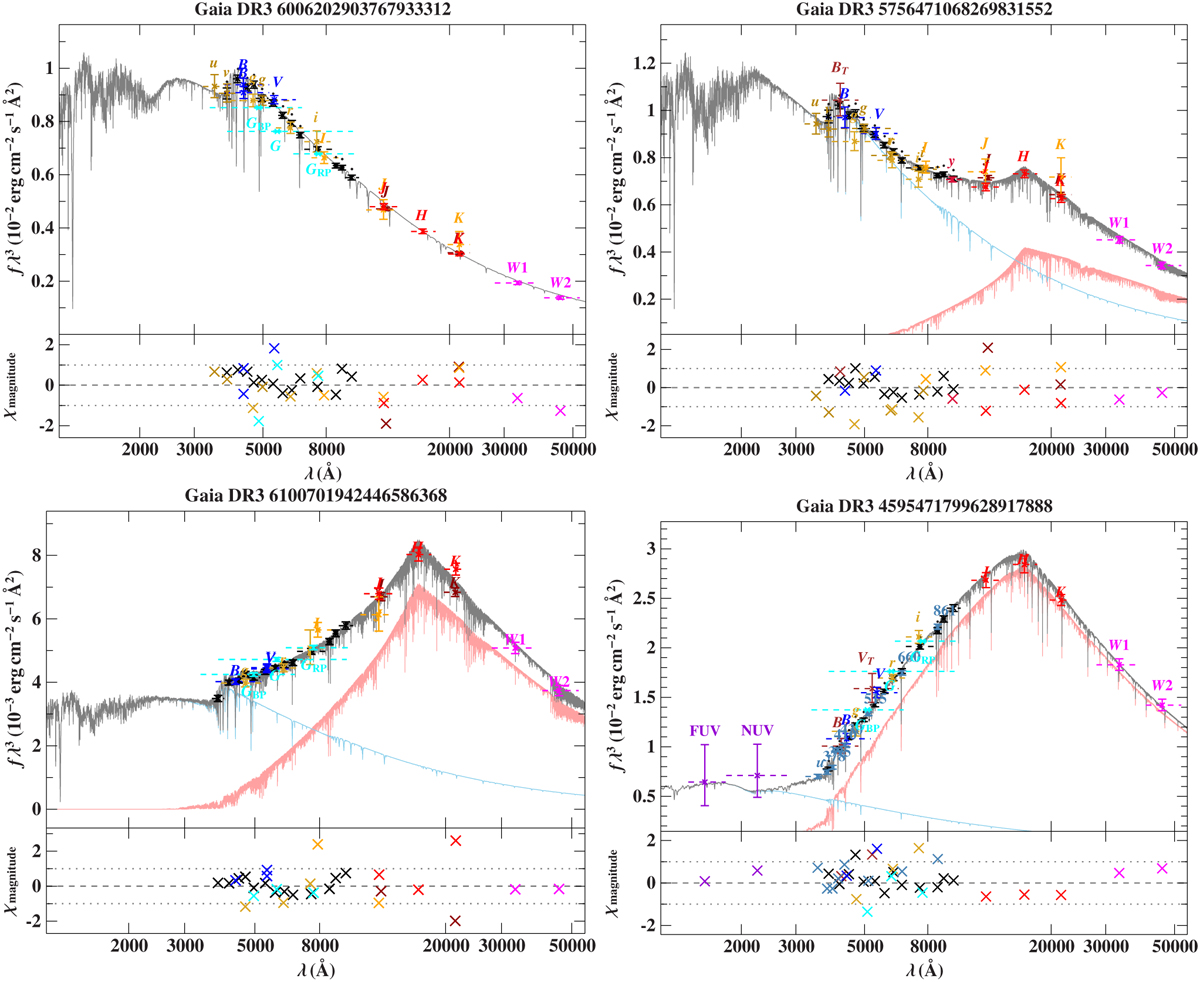
Example spectral energy distribution fits for a single sdOB (top left), an sdB+M0 (top right), sdB+G9V (lower left), and a sdB+F6V (lower right). Photometric fluxes are shown as coloured data points with their respective filter widths as dashed horizontal lines. The grey line shows the combined model spectrum, while the individual contributions of the hot subdwarf and MS companion are given by the blue and red lines, respectively. The different photometric systems in these plots are assigned the following colours: JPLUS (steel blue; von Marttens et al. 2024), Gaia XP (black; Gaia Collaboration 2022), Gaia G/BP/RP (cyan; Gaia Collaboration 2022), WISE (magenta; Cutri et al. 2021), SkyMapper (dark gold; Onken et al. 2019), SDSS (gold; Alam et al. 2015), GALEX (dark violet; Bianchi et al. 2017), Pan-STARRS (crimson; Chambers et al. 2016), VISTA (maroon; Cioni et al. 2011; McMahon et al. 2013), DENIS (orange; DENIS Consortium 2005), 2MASS (red; Cutri et al. 2003), Johnson (blue; Henden et al. 2016; Girard et al. 2011) and Tycho (brown; Høg et al. 2000). Citations for all photometric data used in this work can be found in the acknowledgements.
Current usage metrics show cumulative count of Article Views (full-text article views including HTML views, PDF and ePub downloads, according to the available data) and Abstracts Views on Vision4Press platform.
Data correspond to usage on the plateform after 2015. The current usage metrics is available 48-96 hours after online publication and is updated daily on week days.
Initial download of the metrics may take a while.