Open Access
Fig. B.1.
Download original image
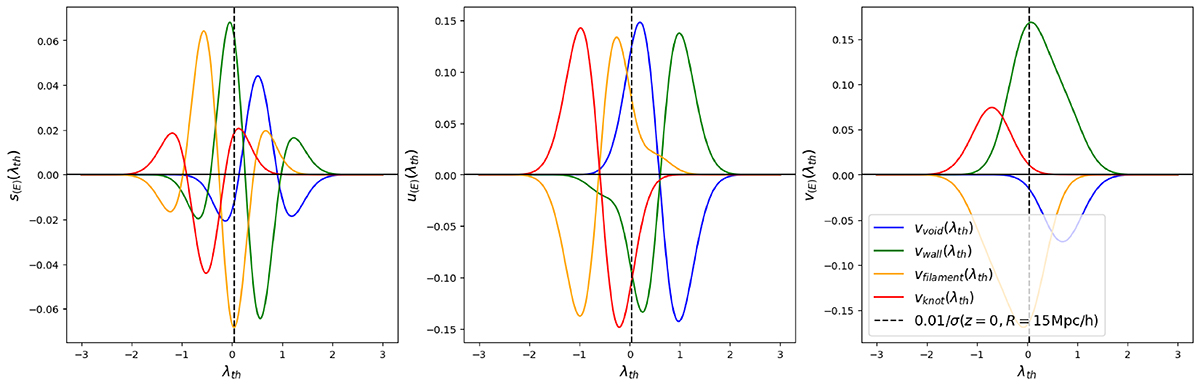
s(E)(λth), u(E)(λth), and v(E)(λth) as a function of threshold predicted by the Gram-Charlier development. Results are shown for the four different environments: voids in blue, walls in green, filaments in orange, and knots in red. The vertical black line is the threshold used in the paper.
Current usage metrics show cumulative count of Article Views (full-text article views including HTML views, PDF and ePub downloads, according to the available data) and Abstracts Views on Vision4Press platform.
Data correspond to usage on the plateform after 2015. The current usage metrics is available 48-96 hours after online publication and is updated daily on week days.
Initial download of the metrics may take a while.