Open Access
Fig. 4.
Download original image
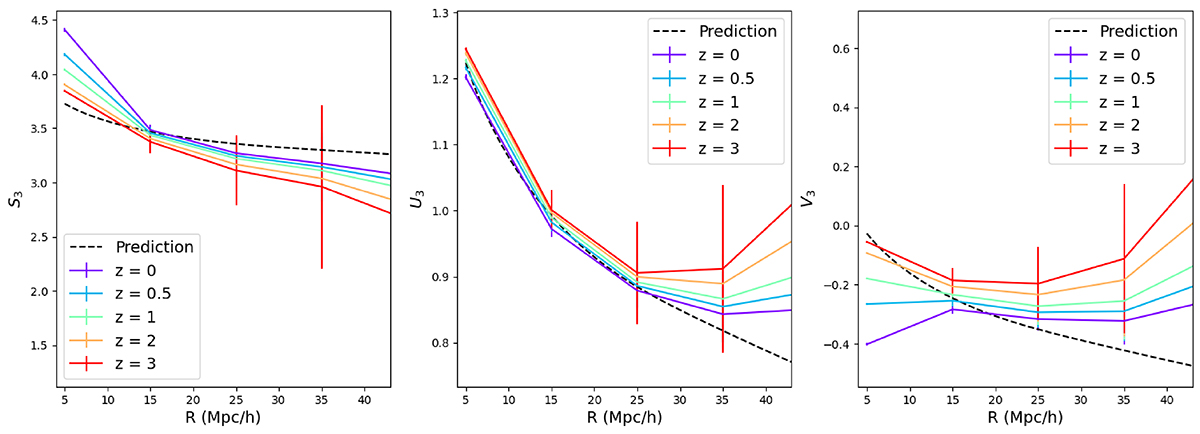
Cumulants S3, U3, and V3 as a function of the smoothing scale R. The dashed black line is the analytical prediction. The coloured lines are the measurements from the simulations at different redshifts.
Current usage metrics show cumulative count of Article Views (full-text article views including HTML views, PDF and ePub downloads, according to the available data) and Abstracts Views on Vision4Press platform.
Data correspond to usage on the plateform after 2015. The current usage metrics is available 48-96 hours after online publication and is updated daily on week days.
Initial download of the metrics may take a while.