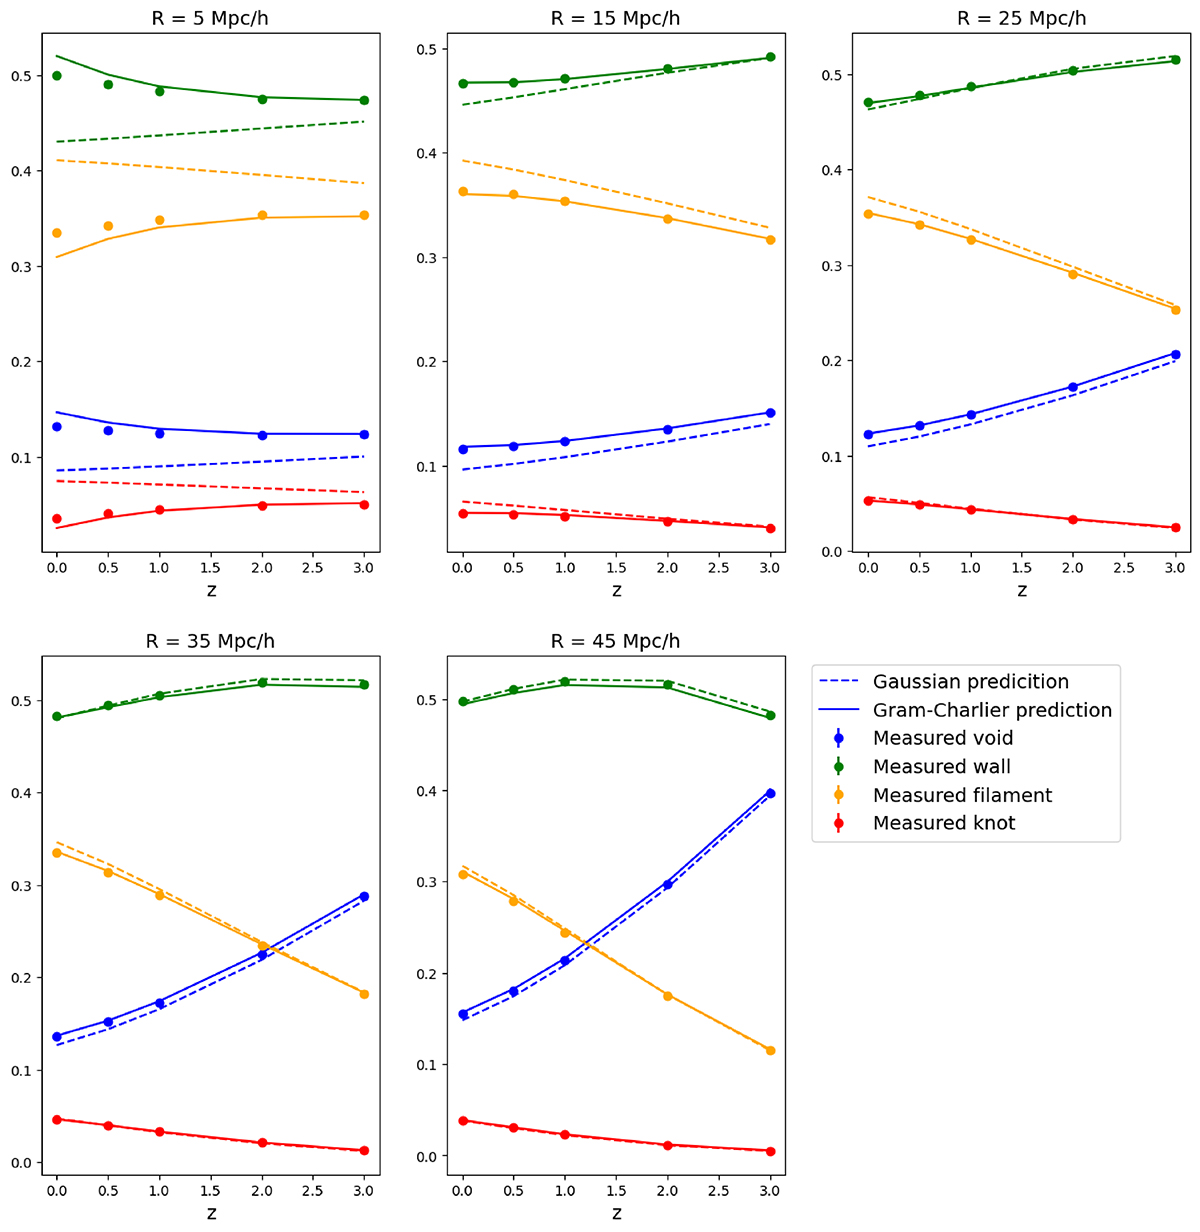
Fig. 2.
Download original image
Probabilities of voids, walls, filaments, and knots as a function of the redshift. These probabilities are shown in blue, green, orange, and red, respectively. Each panel is obtained at a given smoothing scale. Dots are measurements from the simulation, dashed lines are the Gaussian prediction, and solid lines are the prediction obtained with the Gram-Charlier formalism at next-to-leading order. The error bars are errors on the mean but are too small to be distinguished.
Current usage metrics show cumulative count of Article Views (full-text article views including HTML views, PDF and ePub downloads, according to the available data) and Abstracts Views on Vision4Press platform.
Data correspond to usage on the plateform after 2015. The current usage metrics is available 48-96 hours after online publication and is updated daily on week days.
Initial download of the metrics may take a while.