Fig. 1.
Download original image
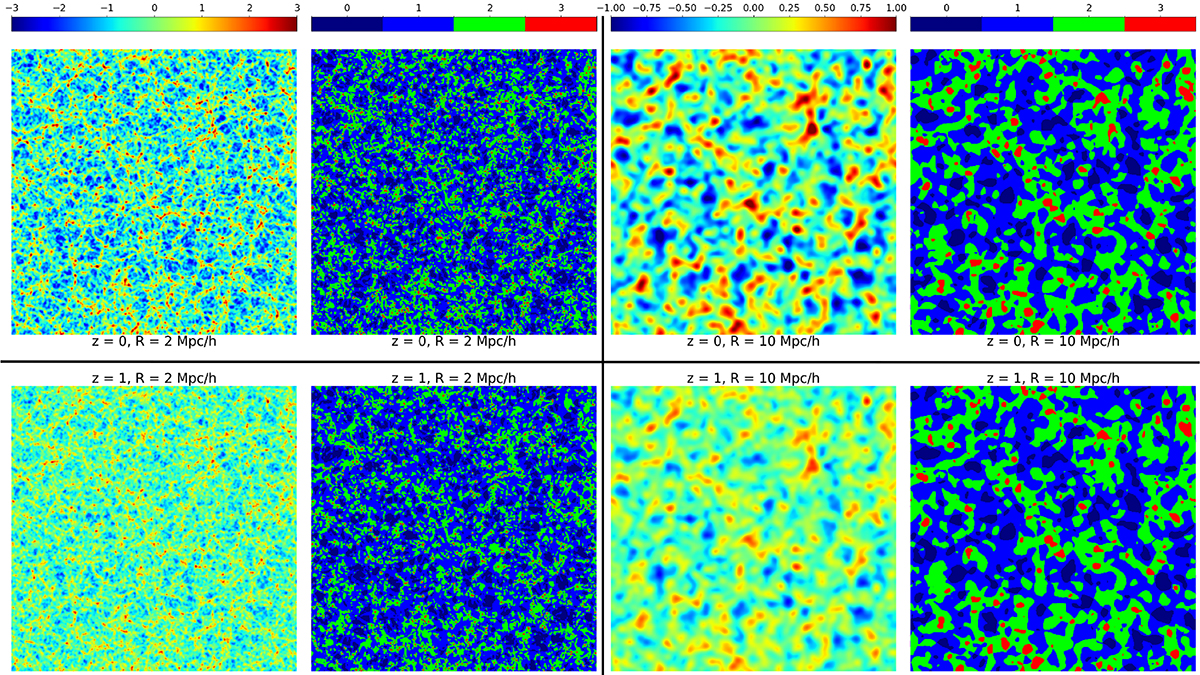
Logarithm of the density contrast of one slice of 1 Gpc h−1 in height and width and 2 Mpc h−1 in thickness of the Quijote simulation (first and third column) compared with the classification obtained using the T-web (second and fourth column) at different redshifts and smoothing scales. For the T-web classification, the colour bar is the number of eigenvalues above our chosen threshold Λth = 0.01 chosen specifically for good visual agreement.
Current usage metrics show cumulative count of Article Views (full-text article views including HTML views, PDF and ePub downloads, according to the available data) and Abstracts Views on Vision4Press platform.
Data correspond to usage on the plateform after 2015. The current usage metrics is available 48-96 hours after online publication and is updated daily on week days.
Initial download of the metrics may take a while.