Fig. 9.
Download original image
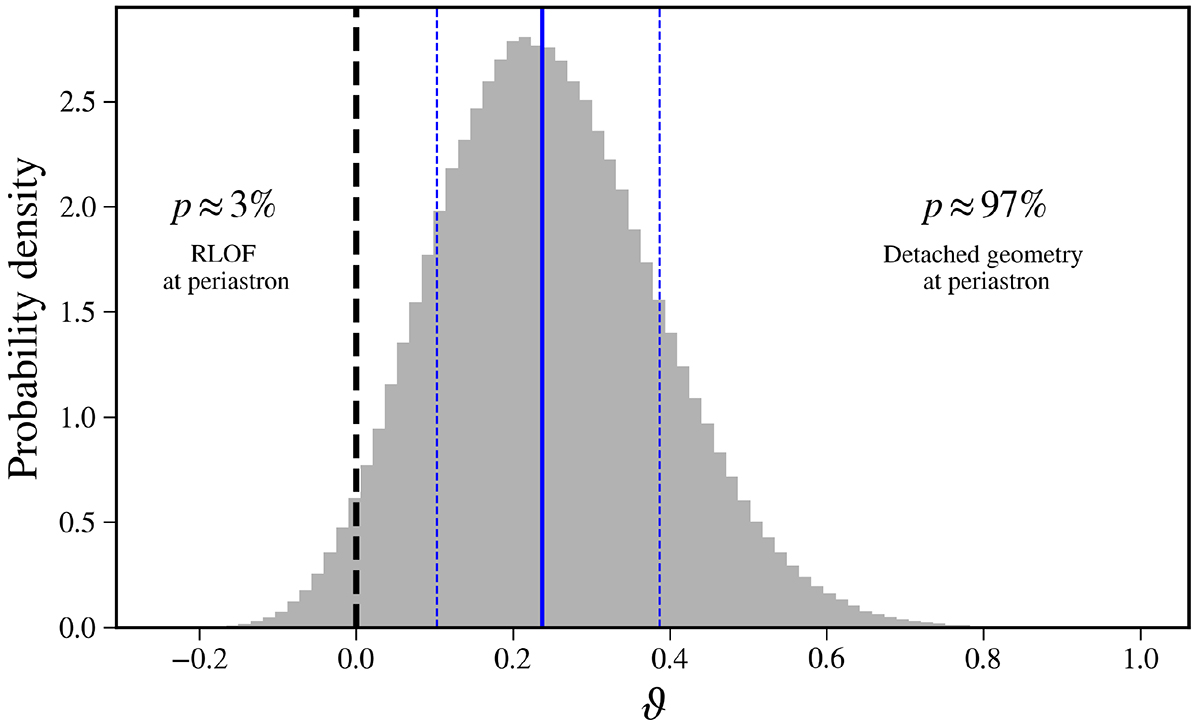
Histogram of the distribution of parameter ϑ = (RL − R1)/R1, resulting from the simulations described in Sect. 4.4. The vertical dashed black line indicates ϑ = 0, when the system becomes semi-detached. The vertical blue lines indicate quantiles at levels of 0.16, 0.5, and 0.84. Only about 3% of samples correspond to an RLOF at periastron, while their majority (∼97%) points toward the detached geometry at periastron.
Current usage metrics show cumulative count of Article Views (full-text article views including HTML views, PDF and ePub downloads, according to the available data) and Abstracts Views on Vision4Press platform.
Data correspond to usage on the plateform after 2015. The current usage metrics is available 48-96 hours after online publication and is updated daily on week days.
Initial download of the metrics may take a while.