Fig. 7.
Download original image
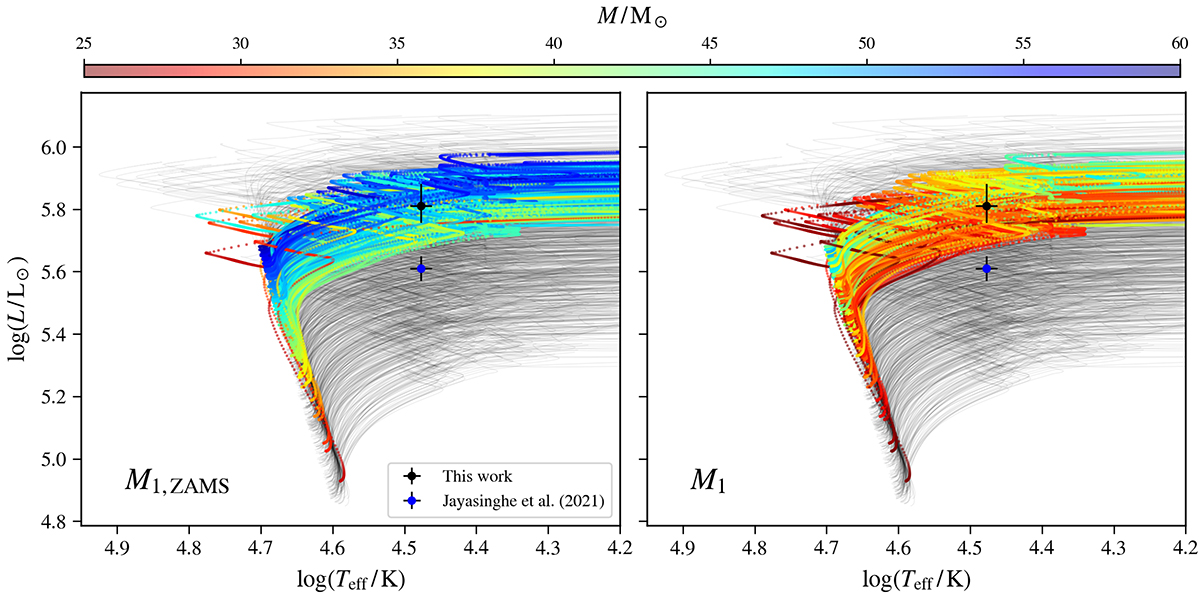
HR diagrams summarizing our simulations described in Sect. 4.2. Black and blue dots show the location of the primary component of ExtEV, according to this paper and the study of J21, respectively. The gray curves show evolutionary tracks that never approach the position of the primary component determined in our study. Conversely, multicolored tracks correspond to those that are within the error box of the ExtEV (black dot) at some phase of the evolution. The color bar above the HR diagrams reflects M1, ZAMS (left panel) and M1 (right panel) and is common to both panels.
Current usage metrics show cumulative count of Article Views (full-text article views including HTML views, PDF and ePub downloads, according to the available data) and Abstracts Views on Vision4Press platform.
Data correspond to usage on the plateform after 2015. The current usage metrics is available 48-96 hours after online publication and is updated daily on week days.
Initial download of the metrics may take a while.