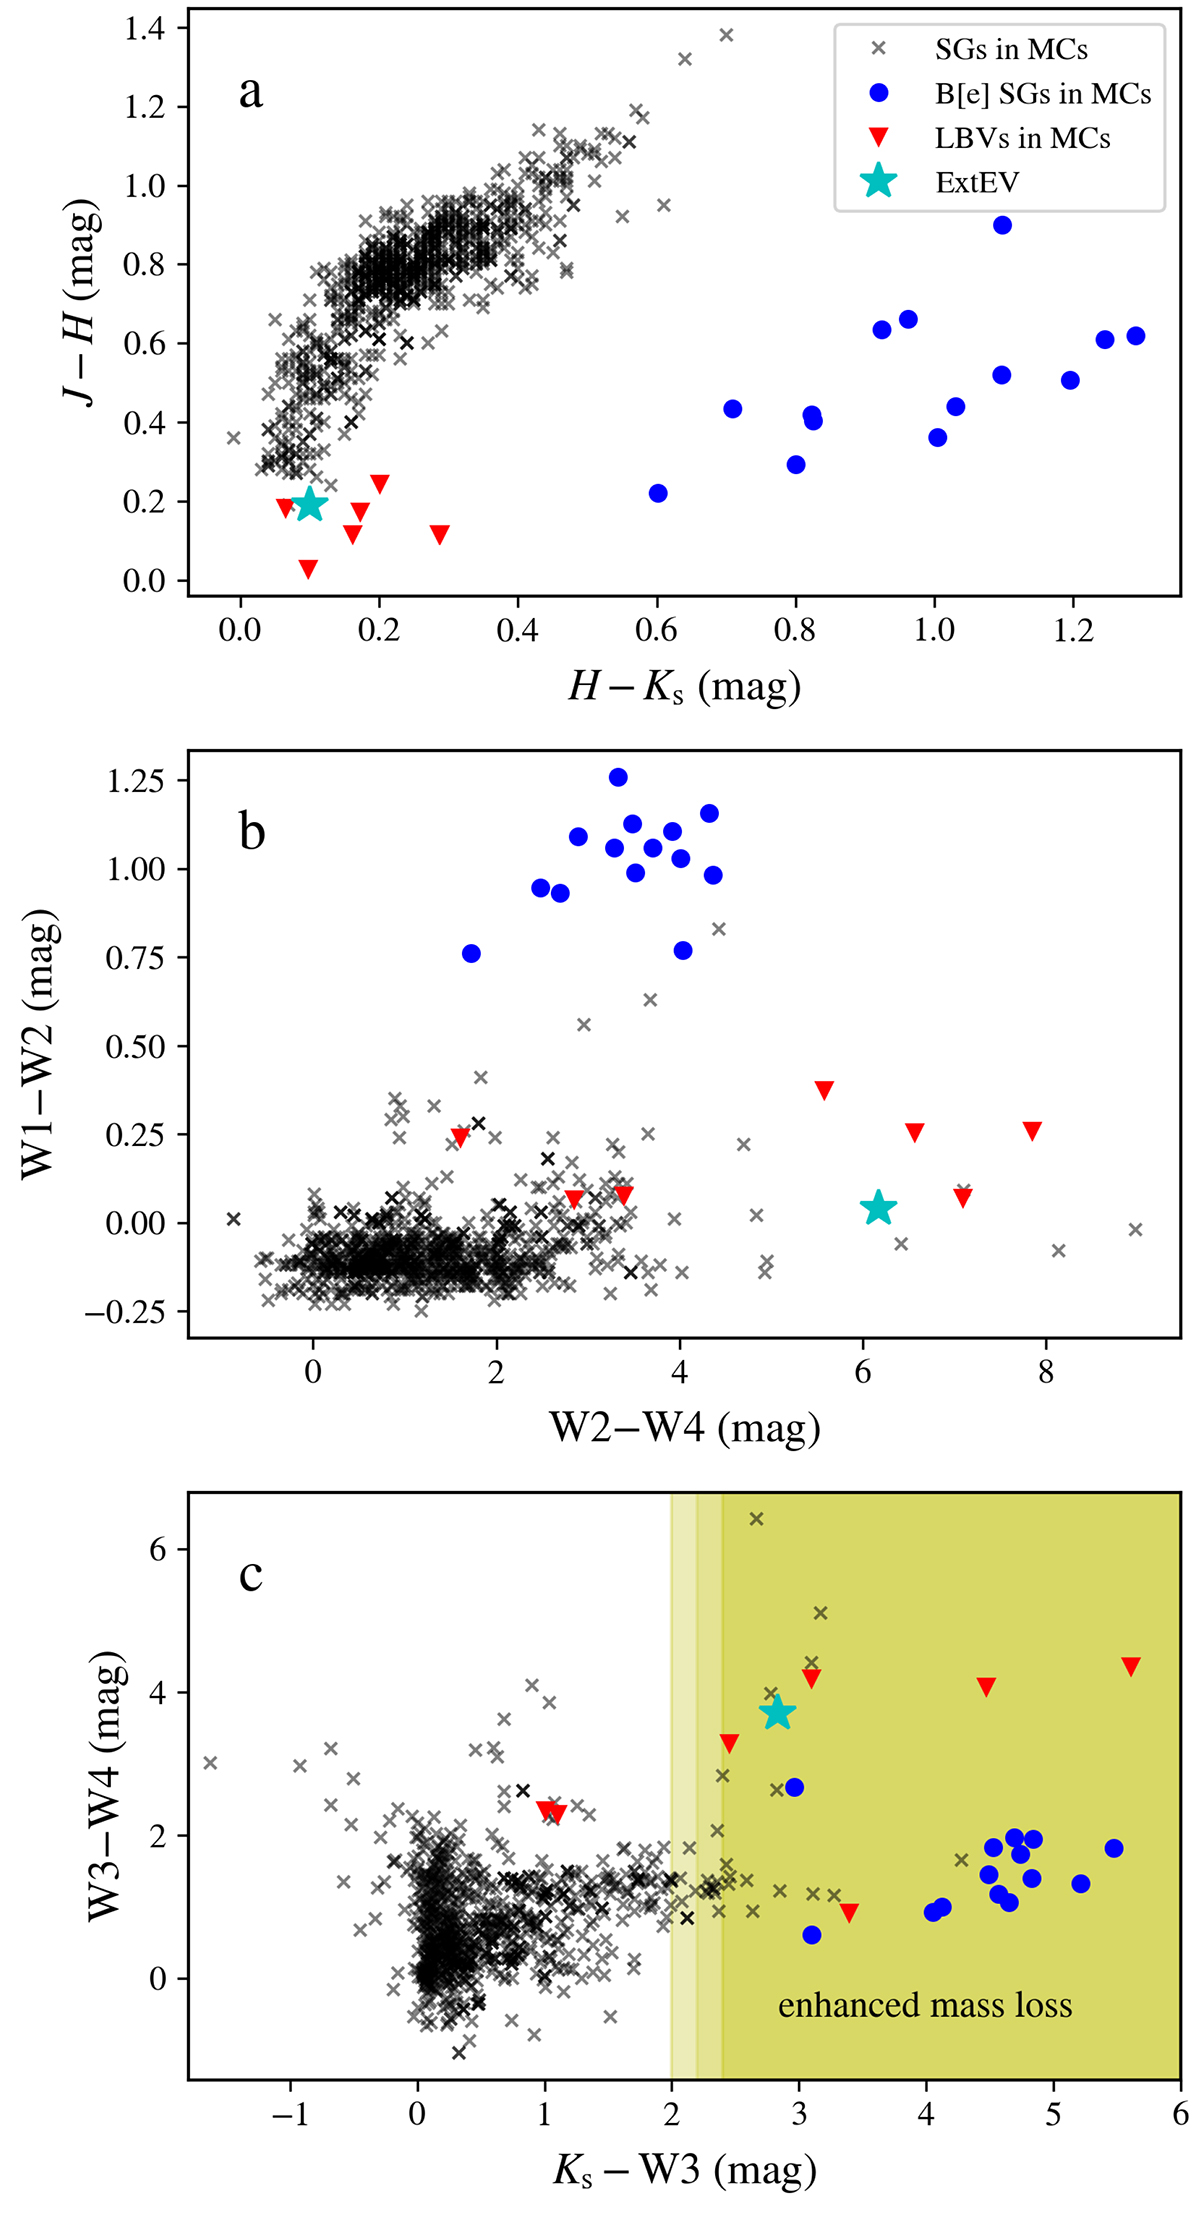
Fig. 6.
Download original image
Infrared color-color diagrams for ExtEV. The position of ExtEV is marked by the cyan star in each panel. The blue dots and red triangles correspond to the B[e] SGs and LBVs located in the Magellanic Clouds, respectively. Their photometric properties were adopted from Kraus (2019). Black crosses refer to the sample of late-type SGs selected by González-Fernández et al. (2015). The shaded region in panel (c) shows the area with color index (Ks − W3)≳2 mag, where SGs with enhanced mass loss are suspected to be located.
Current usage metrics show cumulative count of Article Views (full-text article views including HTML views, PDF and ePub downloads, according to the available data) and Abstracts Views on Vision4Press platform.
Data correspond to usage on the plateform after 2015. The current usage metrics is available 48-96 hours after online publication and is updated daily on week days.
Initial download of the metrics may take a while.