Fig. 5.
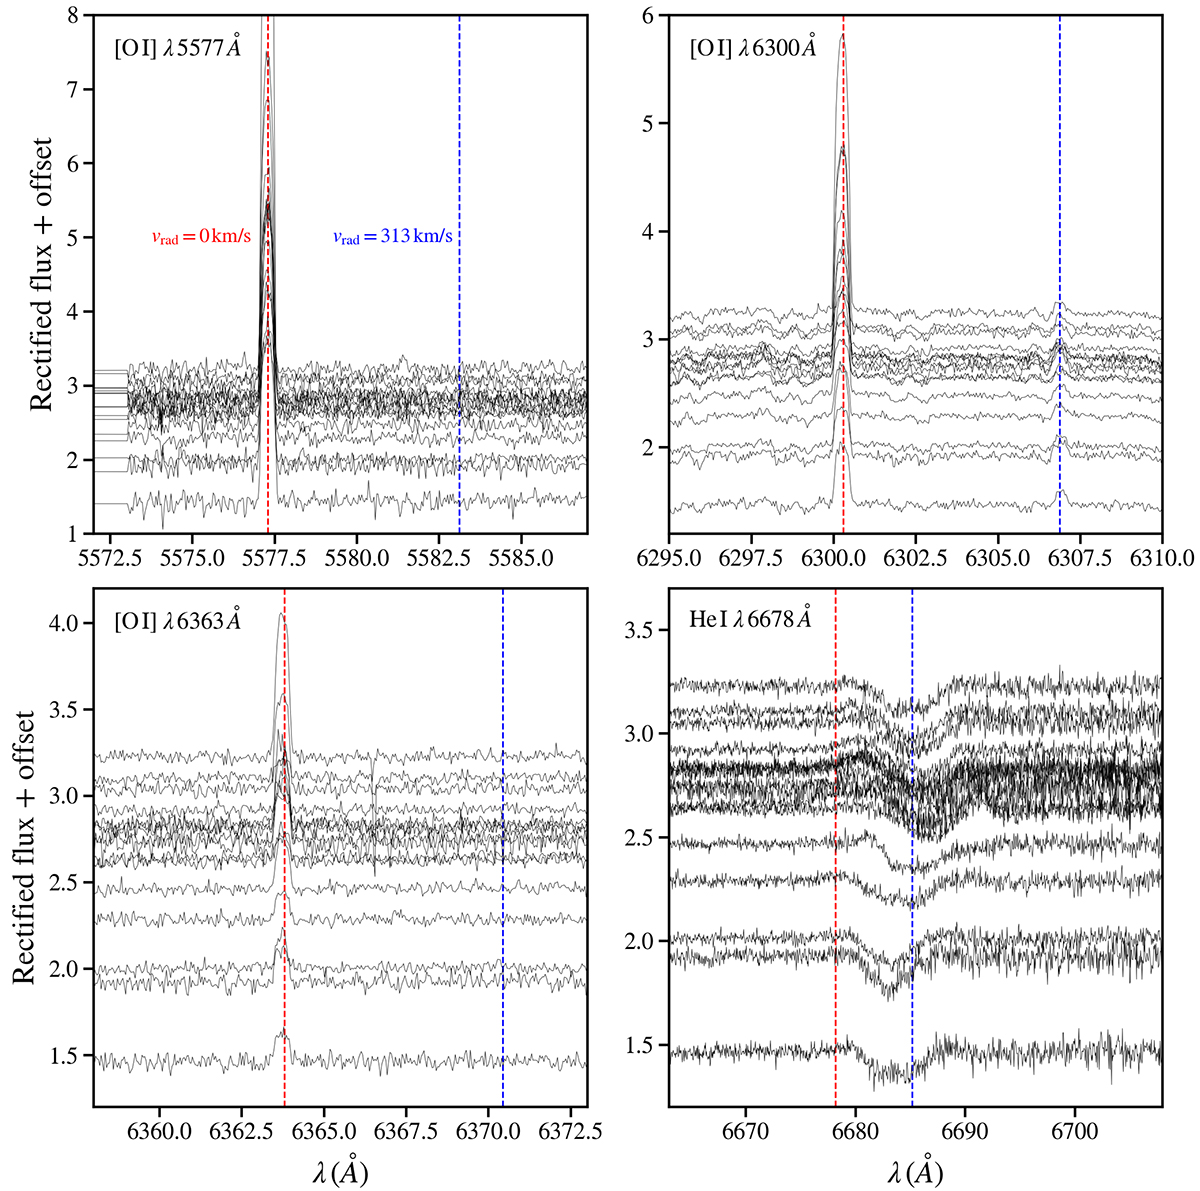
Download original image
Small sections of the SALT spectra showing [O I] emission lines at their laboratory wavelengths but not in the rest frame of ExtEV. The rest-frame wavelengths of the lines shown are indicated in each panel in the top left corner. The spectra are shifted vertically according to the orbital phase. The vertical red and blue dashed lines correspond to RVs of 0 (geocoronal emission) and 313 km s−1 (systemic velocity of ExtEV), respectively. For comparison, the bottom right panel shows the He I absorption line originating from the photosphere of the primary component of ExtEV.
Current usage metrics show cumulative count of Article Views (full-text article views including HTML views, PDF and ePub downloads, according to the available data) and Abstracts Views on Vision4Press platform.
Data correspond to usage on the plateform after 2015. The current usage metrics is available 48-96 hours after online publication and is updated daily on week days.
Initial download of the metrics may take a while.