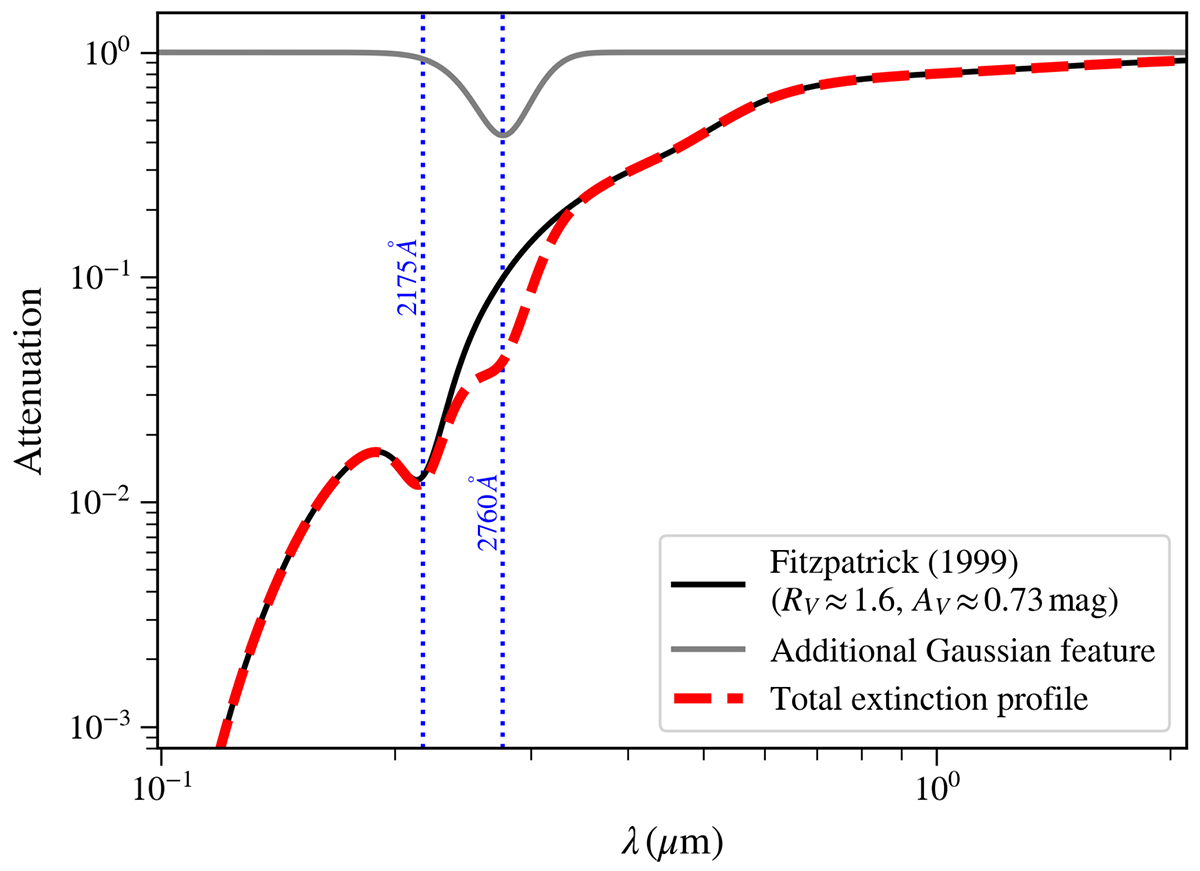
Fig. 4.
Download original image
Extinction law resulting from the best fit to the observed SED of ExtEV. The black curve refers to the interstellar dust extinction function of Fitzpatrick (1999) with the parameters given in the legend. The additional extinction feature is shown with the gray line, while the red dashed curve corresponds to the total extinction function (the product of black and gray curves). With a pair of blue vertical dotted lines, we have marked the positions of the two local minima in the total extinction function. More details can be found in the main text.
Current usage metrics show cumulative count of Article Views (full-text article views including HTML views, PDF and ePub downloads, according to the available data) and Abstracts Views on Vision4Press platform.
Data correspond to usage on the plateform after 2015. The current usage metrics is available 48-96 hours after online publication and is updated daily on week days.
Initial download of the metrics may take a while.