Fig. 3.
Download original image
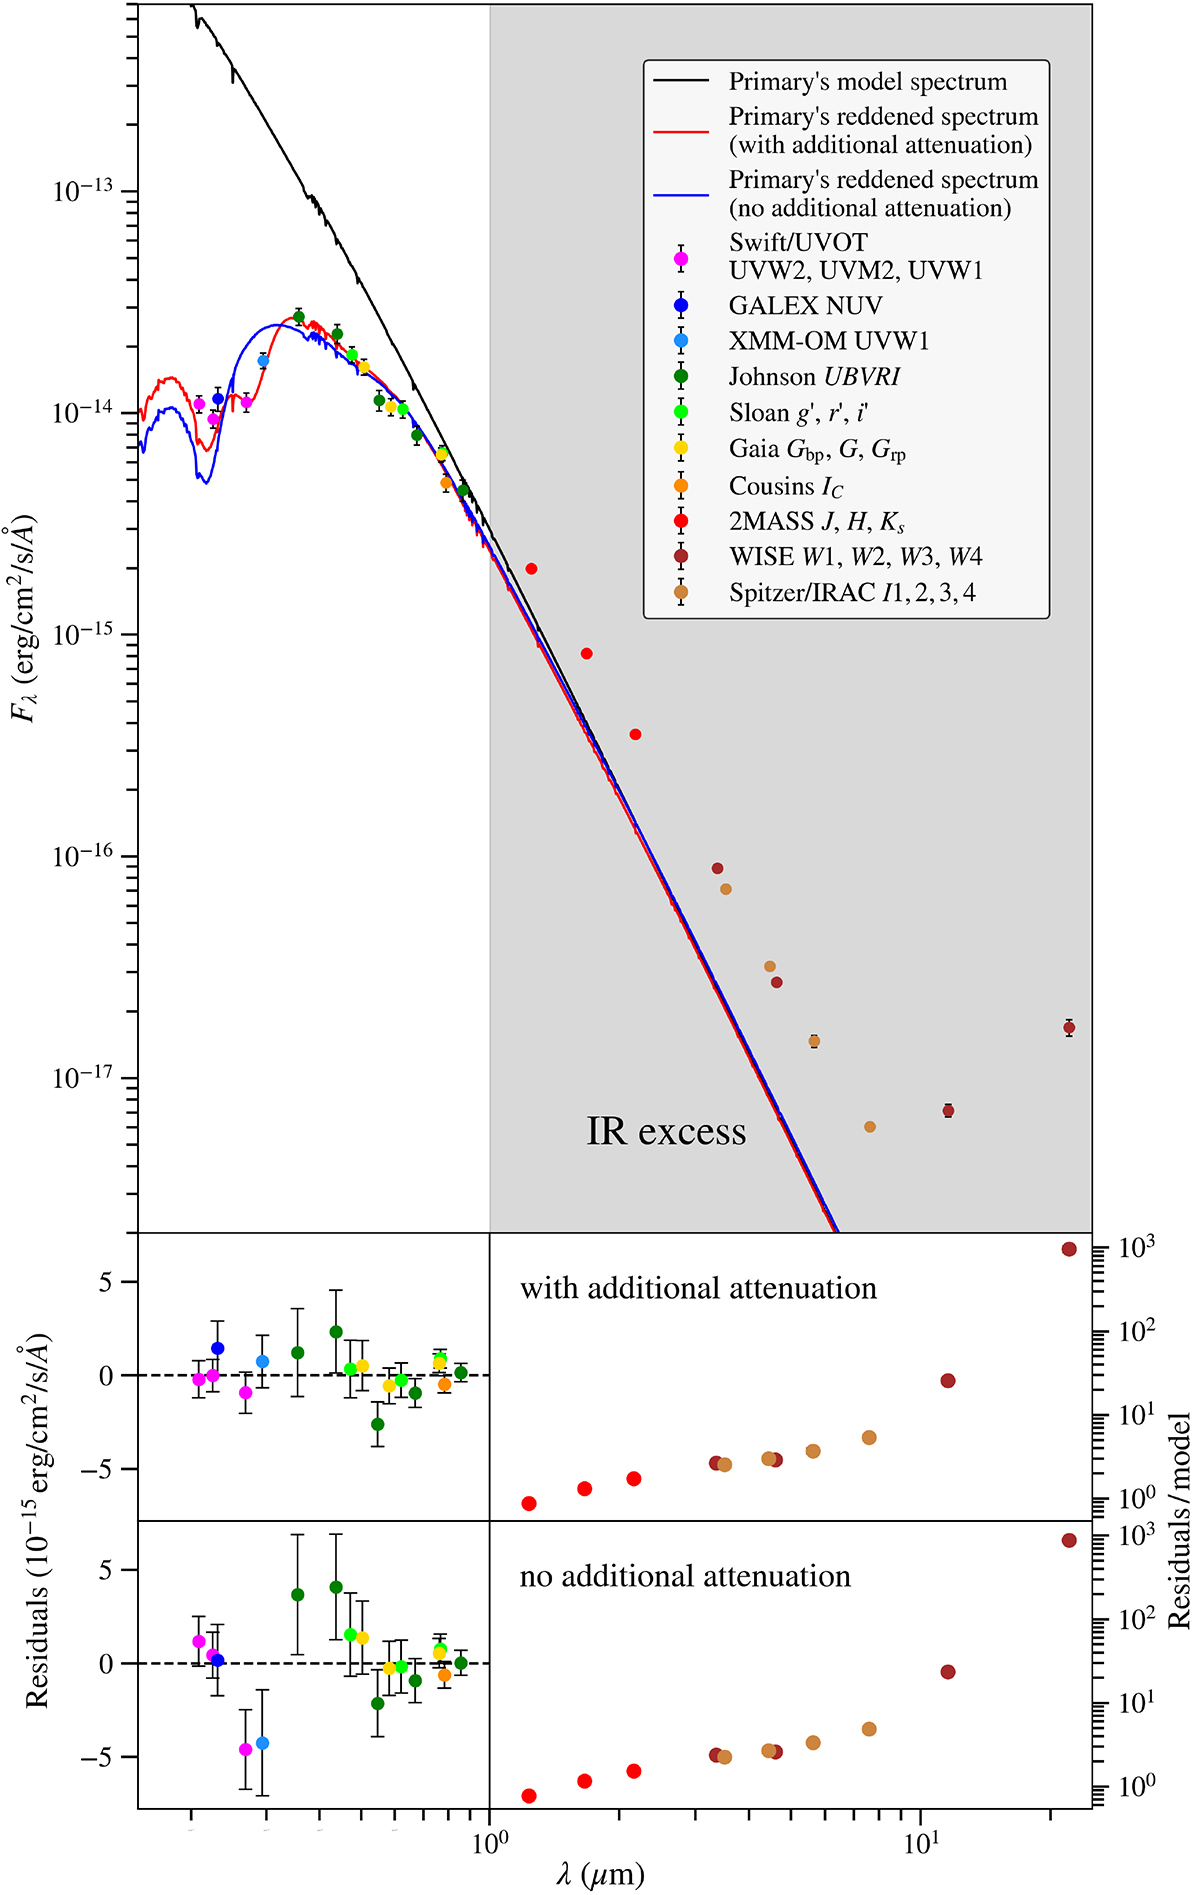
Results of the SED fitting to the multiband photometry of ExtEV. The upper panel shows the absolute fluxes calculated from magnitudes given in Table 3 (dots are color-coded according to the legend). The model spectrum of the primary component is shown with a black line, its reddened versions with a red line (with additional attenuation) and a blue line (without it). The infrared excess is clearly visible and indicated by the shaded area. The middle and lower panels show the residuals from the best fit, with and without the additional attenuation, respectively. For residuals presented on the left (UV and optical range), the ordinate axes are linearly scaled while the residuals in the IR range are normalized by the model values and logarithmically scaled.
Current usage metrics show cumulative count of Article Views (full-text article views including HTML views, PDF and ePub downloads, according to the available data) and Abstracts Views on Vision4Press platform.
Data correspond to usage on the plateform after 2015. The current usage metrics is available 48-96 hours after online publication and is updated daily on week days.
Initial download of the metrics may take a while.