Fig. 2.
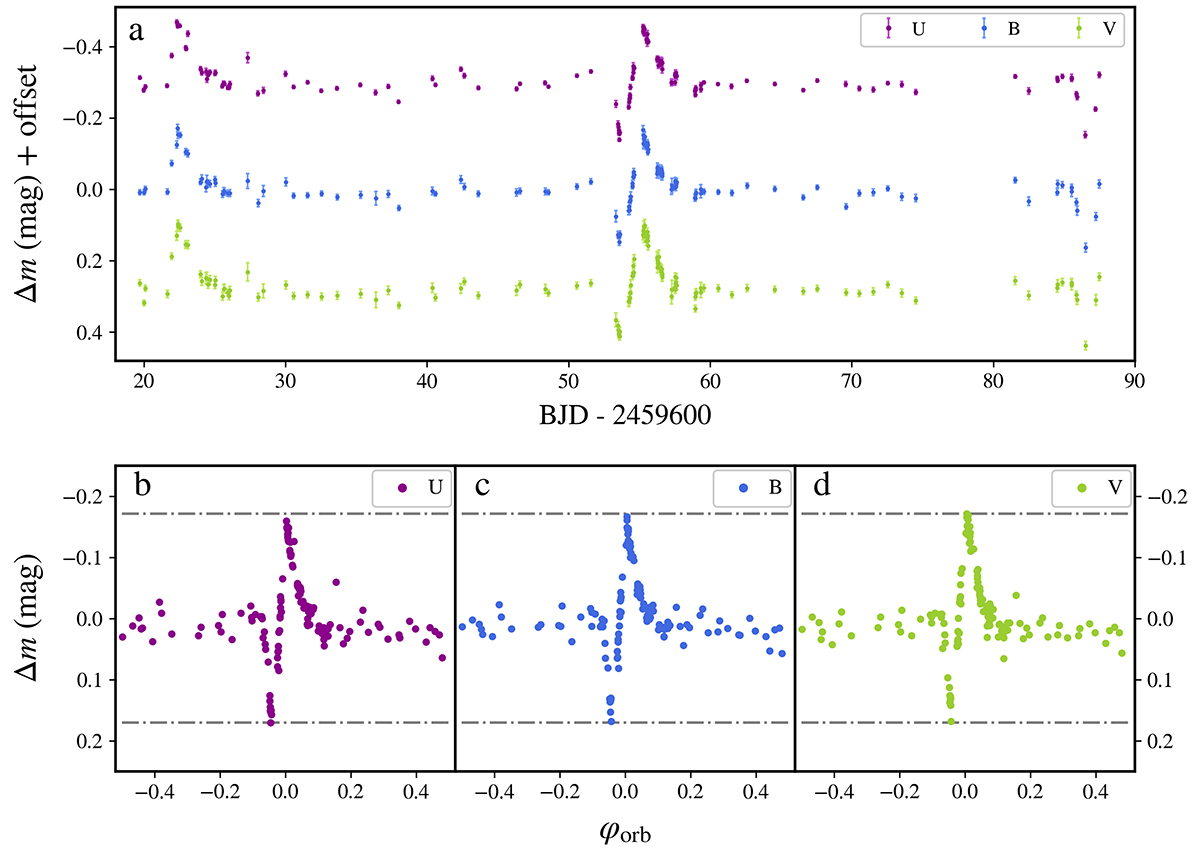
Download original image
LCOGT light curves of ExtEV in Johnson U (purple dots), B (blue dots), and V (green dots) passbands. Panel a shows the light curves. A ±0.25 mag vertical offset was applied to U and V-filter light curves to avoid overlapping. Panels b–d show the light curves phased with the orbital period. Phase zero corresponds to the time of periastron passage. In addition, we have drawn dash-dotted lines in each of the lower panels to indicate the range of variability during the heartbeat. The plot illustrates that the range is virtually the same in all three passbands.
Current usage metrics show cumulative count of Article Views (full-text article views including HTML views, PDF and ePub downloads, according to the available data) and Abstracts Views on Vision4Press platform.
Data correspond to usage on the plateform after 2015. The current usage metrics is available 48-96 hours after online publication and is updated daily on week days.
Initial download of the metrics may take a while.