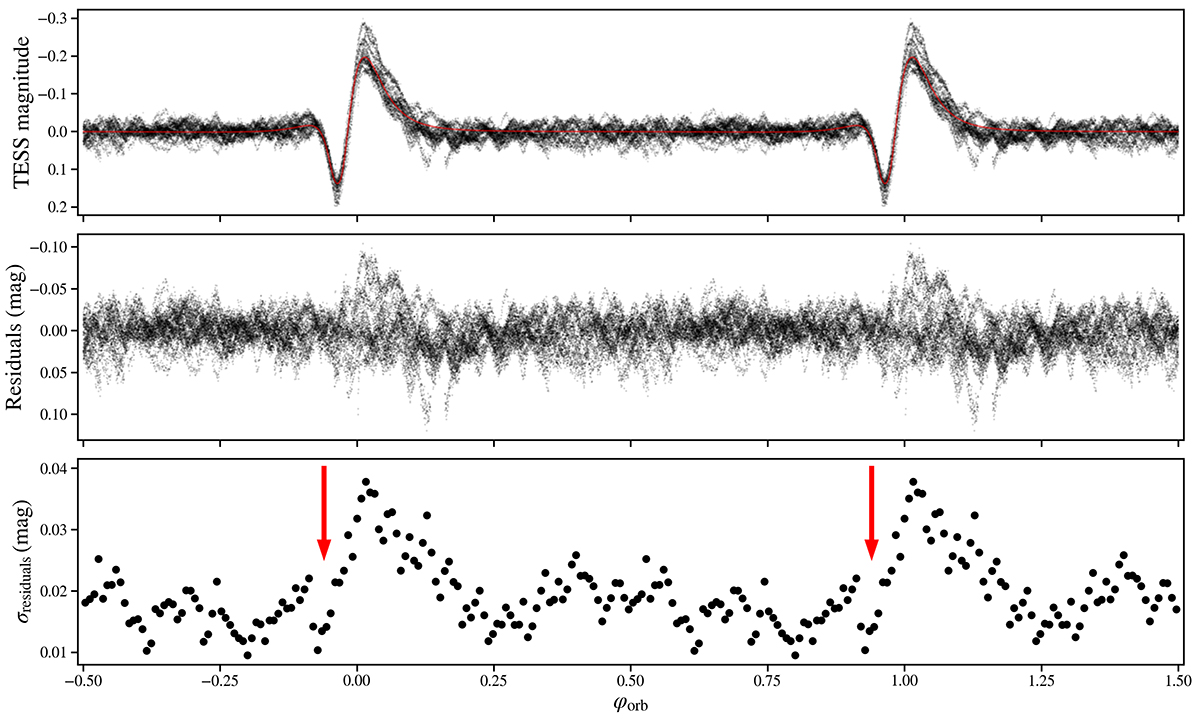
Fig. 14.
Download original image
Changes of the scatter of residuals from the fit of our model to the light curve of ExtEV. The upper panel shows the TESS light curve (black points) folded with the orbital period, while the red curve corresponds to the best-fitting model from Fig. 13. Phase φorb = 0 corresponds to the periastron passage. The middle panel presents the residuals from the fit shown in the upper panel. The lower panel shows the changes in the local scatter of the residuals, calculated as the standard deviation of the residuals in 0.007 phase intervals. The red arrows indicate a sudden decrease in the scatter of residuals around the phase of superior conjunction.
Current usage metrics show cumulative count of Article Views (full-text article views including HTML views, PDF and ePub downloads, according to the available data) and Abstracts Views on Vision4Press platform.
Data correspond to usage on the plateform after 2015. The current usage metrics is available 48-96 hours after online publication and is updated daily on week days.
Initial download of the metrics may take a while.