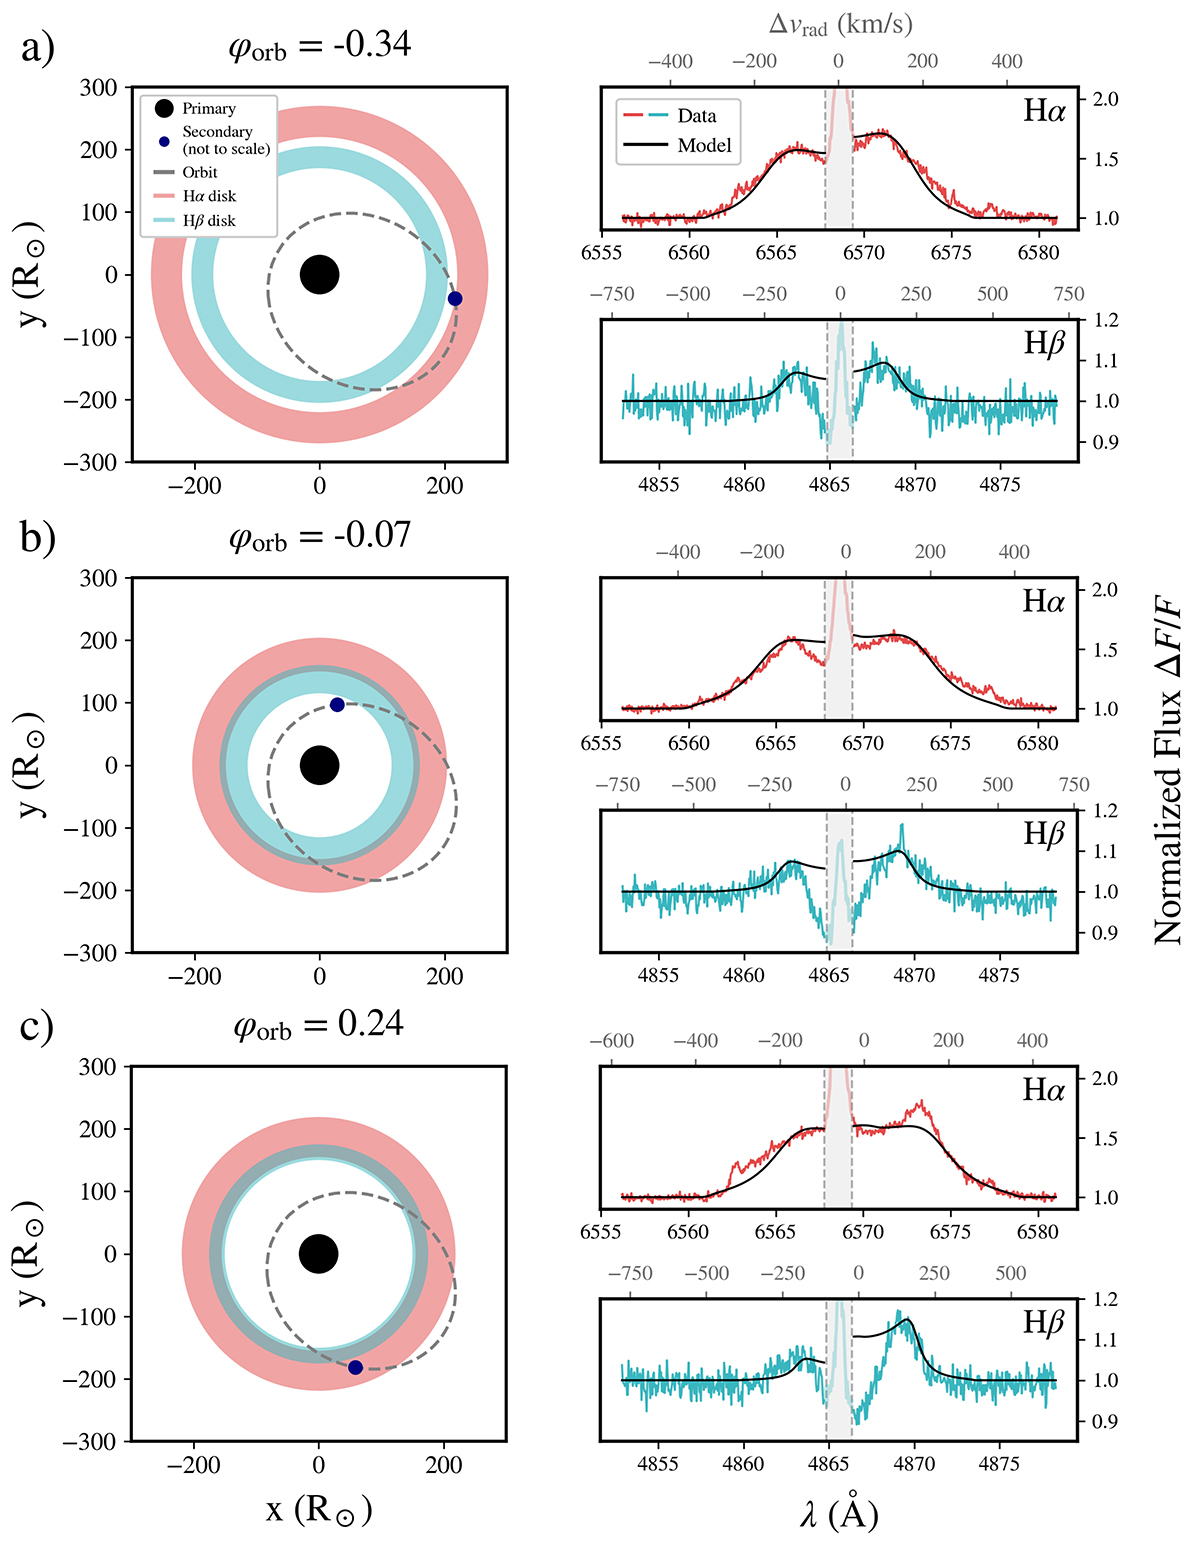
Fig. 11.
Download original image
Models of the Keplerian rings around the primary component of ExtEV. Each set of figures (a, b, and c) corresponds to a different orbital phase φorb provided above each set. The right-hand panels show the observed Hα (salmon) and Hβ (aqua) lines to which the theoretical profiles (black curves) were fit. For each spectrum, two rings were fit separately, one responsible only for the Hα emission and the other for the Hβ emission. The narrow nebular emission of the LMC (gray region bounded by vertical dashed lines) was excluded from the fit. The left-hand panels show the resulting ring geometry compared to the size of the primary component (black circle) and the size of the orbit of the secondary component (dashed ellipse, secondary component size is not to scale). More details and discussion can be found in the main text.
Current usage metrics show cumulative count of Article Views (full-text article views including HTML views, PDF and ePub downloads, according to the available data) and Abstracts Views on Vision4Press platform.
Data correspond to usage on the plateform after 2015. The current usage metrics is available 48-96 hours after online publication and is updated daily on week days.
Initial download of the metrics may take a while.