Fig. 10.
Download original image
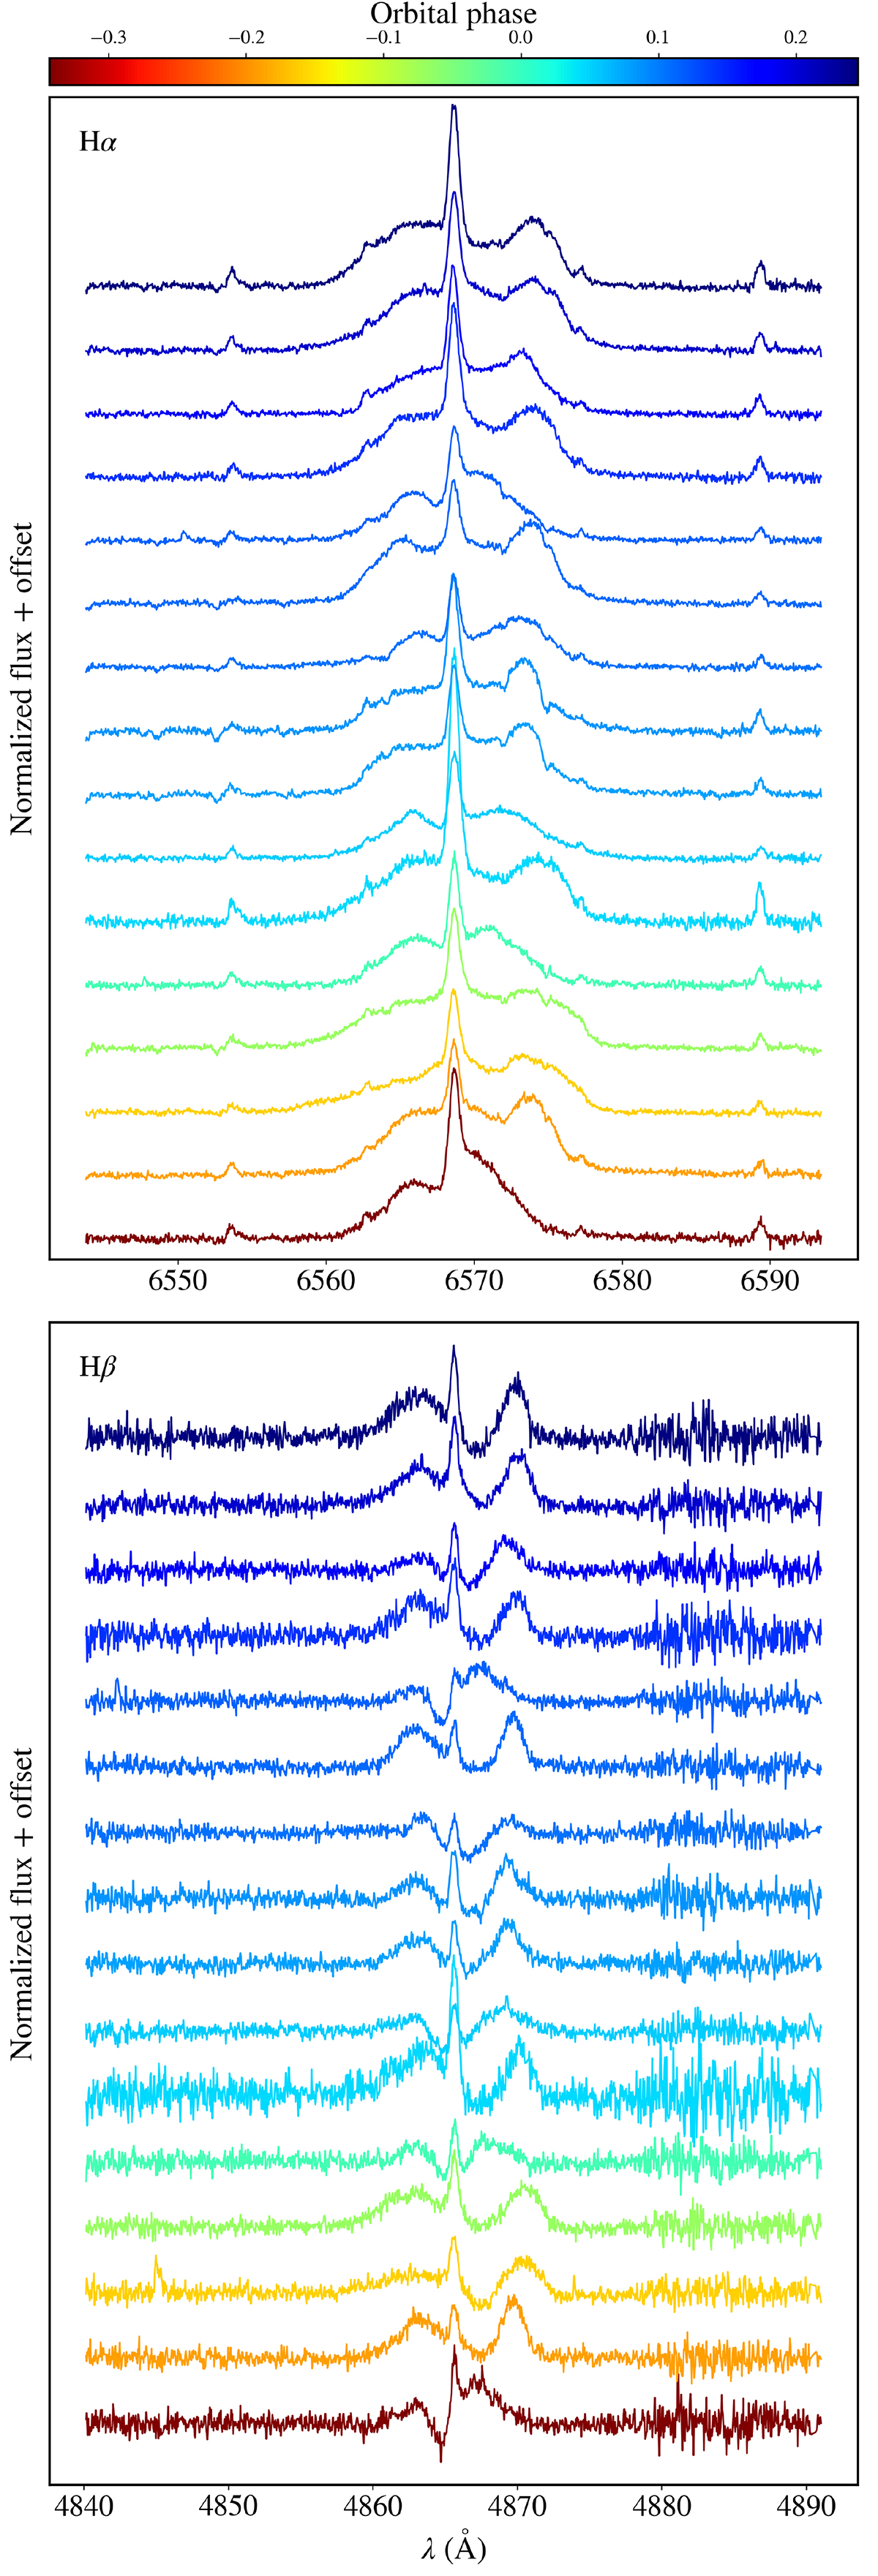
Fragments of SALT/HRS spectra of ExtEV near the Hα (upper panel) and Hβ (lower panel) lines. The spectra are color-coded according to the orbital phase (the color bar is located at the top of the figure), with zero phase corresponding to the periastron passage. The narrow emission in the center of the spectrum is of nebular origin.
Current usage metrics show cumulative count of Article Views (full-text article views including HTML views, PDF and ePub downloads, according to the available data) and Abstracts Views on Vision4Press platform.
Data correspond to usage on the plateform after 2015. The current usage metrics is available 48-96 hours after online publication and is updated daily on week days.
Initial download of the metrics may take a while.