Fig. 6.
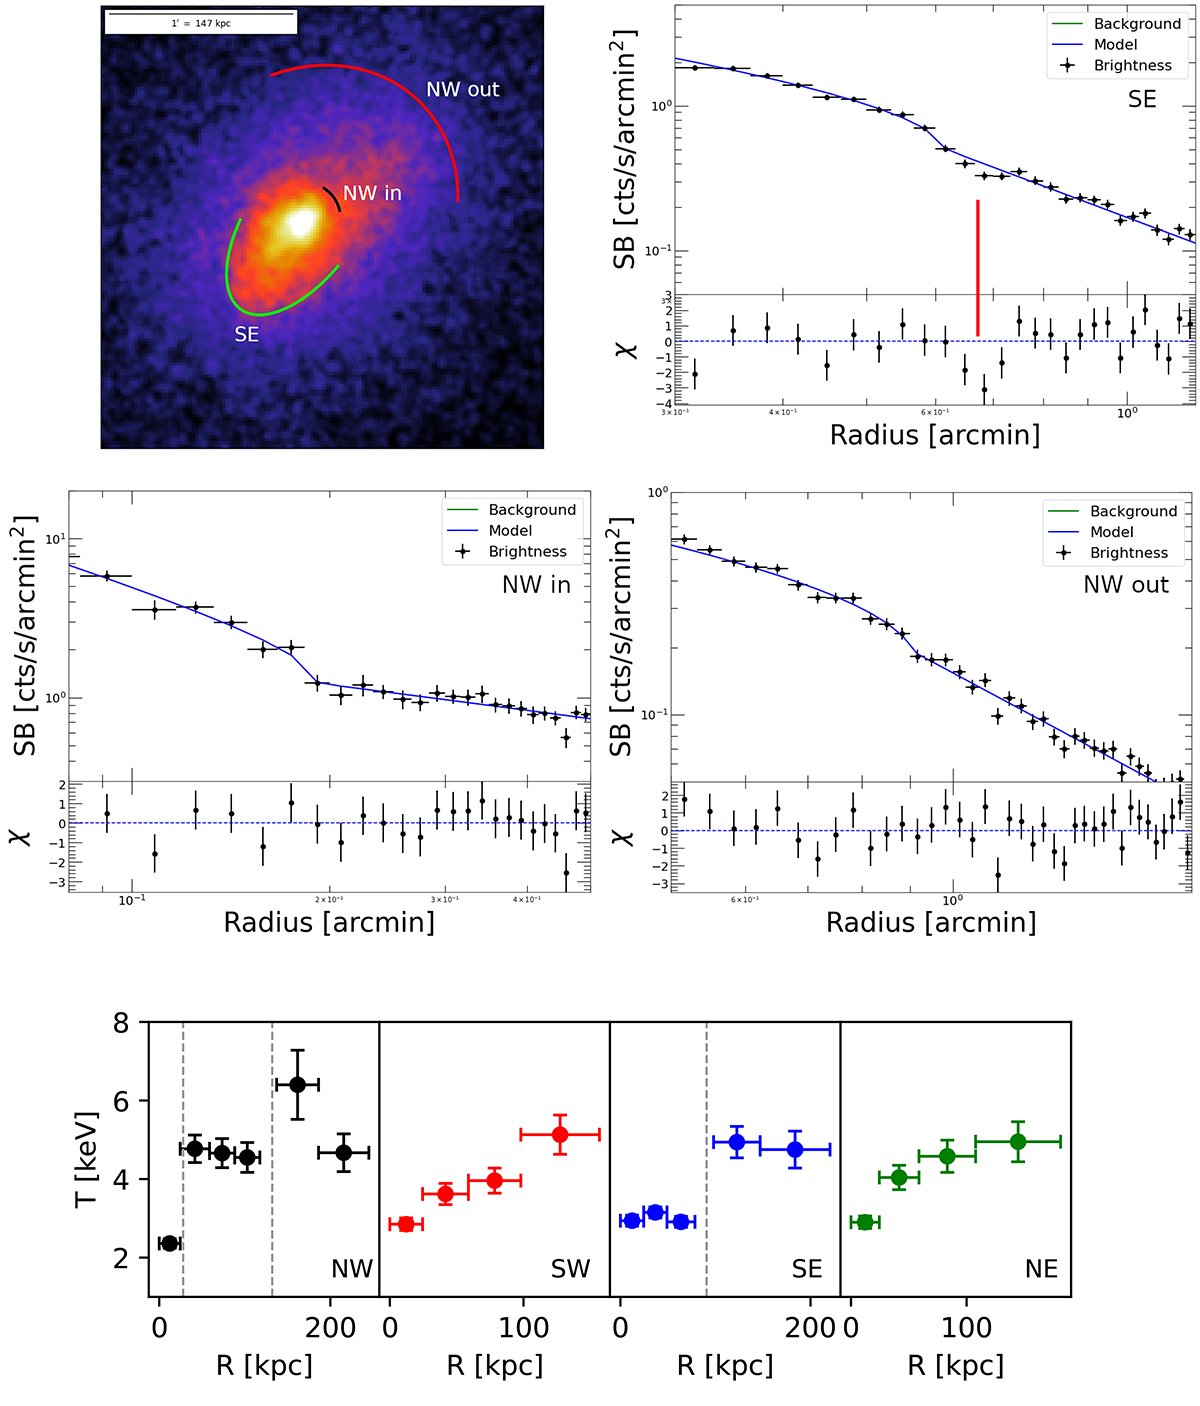
Download original image
A1068 cold fronts analysis. Upper left panel: X-ray Chandra image with indicated the positions of cold fronts: red arc for the NW outer CF, black arc for the NW inner CF and green arc for the SE CF. Upper right panel: best-fitting broken power-law model (blue line) with associated residuals of the SB discontinuity in the south-east profile. The red line indicates the position of the putative PDL. Middle left panel: same as before for the inner SB discontinuity in the north-west profile. Middle right panel: same as before for the outer SB discontinuity in the north-west profile. Lower panels: Temperature profiles across the north-west (black), south-west (red), south-east (blue) and north-east (green) sectors. The dashed grey lines indicate the position of cold fronts.
Current usage metrics show cumulative count of Article Views (full-text article views including HTML views, PDF and ePub downloads, according to the available data) and Abstracts Views on Vision4Press platform.
Data correspond to usage on the plateform after 2015. The current usage metrics is available 48-96 hours after online publication and is updated daily on week days.
Initial download of the metrics may take a while.