Open Access
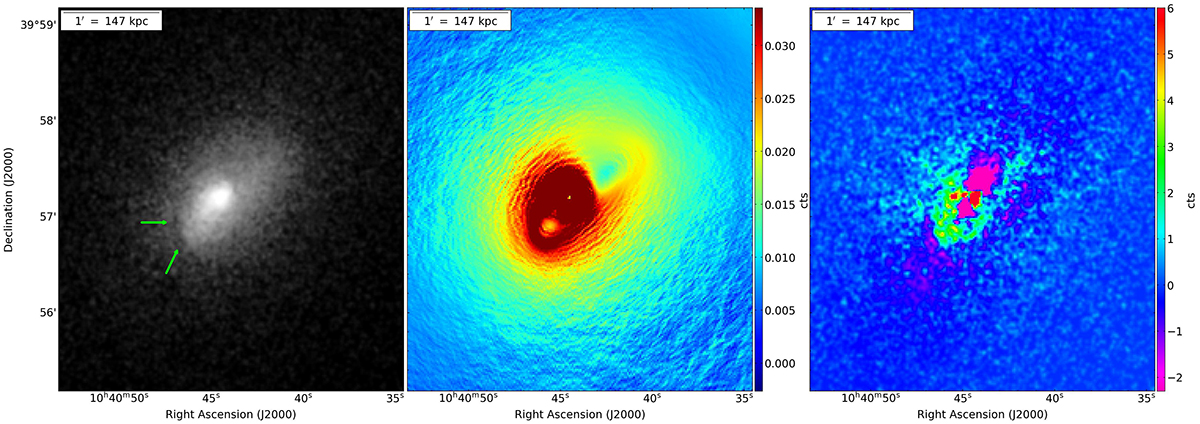
Fig. 5.
Download original image
X-ray images of A1068. Left panel: Chandra 0.5–7.0 keV image. Green arrows indicate the position of PDL. Central panel: X-ray surface brightness gradient map. Right panel: Residual image after the subtraction of an elliptical double β-model.
Current usage metrics show cumulative count of Article Views (full-text article views including HTML views, PDF and ePub downloads, according to the available data) and Abstracts Views on Vision4Press platform.
Data correspond to usage on the plateform after 2015. The current usage metrics is available 48-96 hours after online publication and is updated daily on week days.
Initial download of the metrics may take a while.