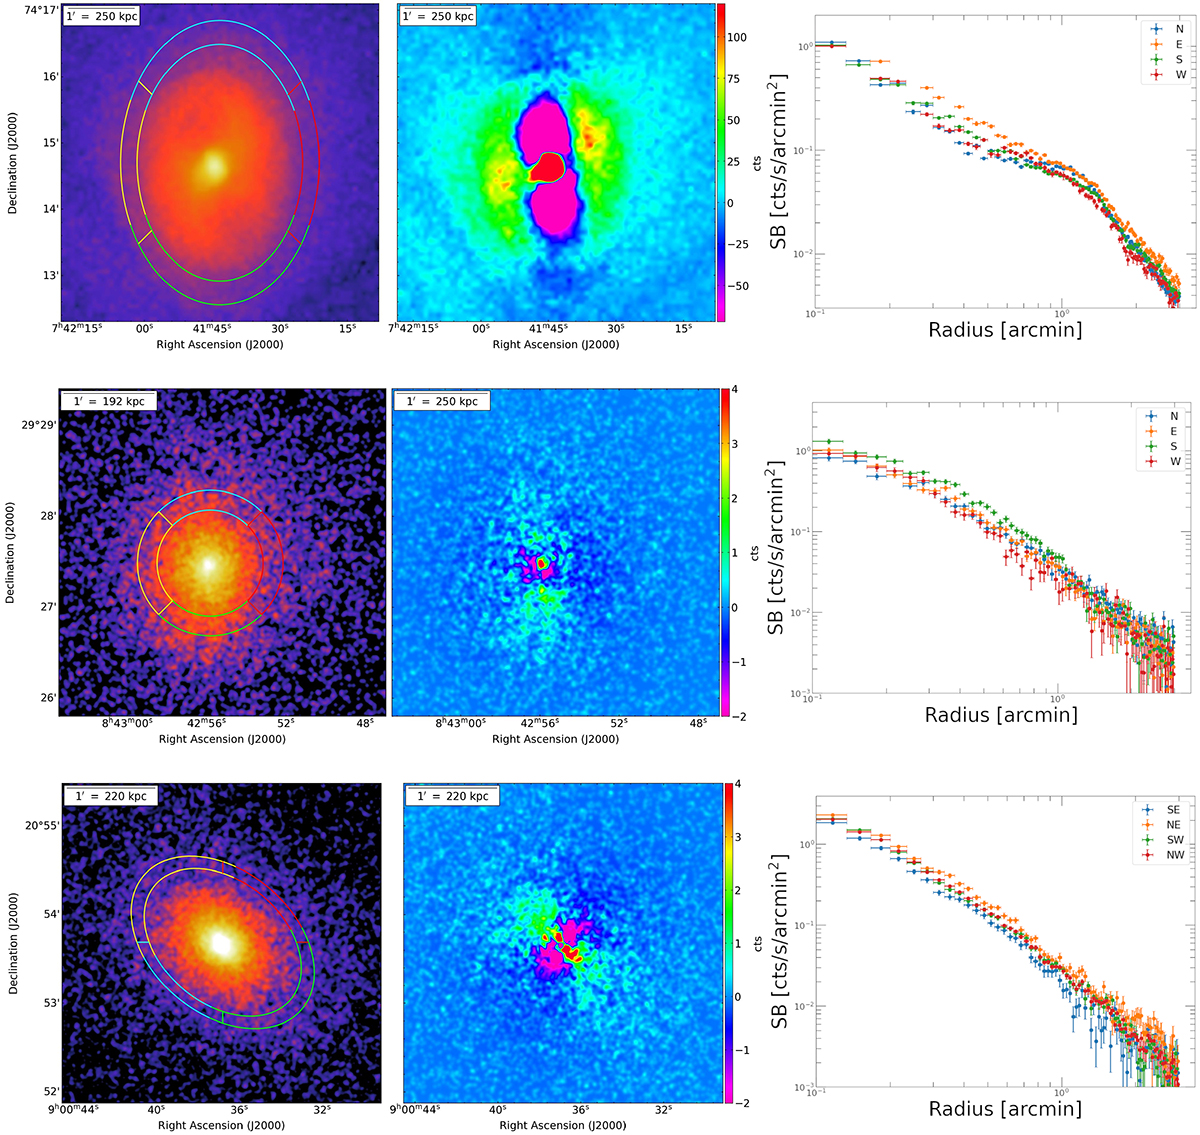
Fig. A.7.
Download original image
X-ray analysis of MS 0735.6+7421 (First row), MS 0839.8+2938 (Second row) and Z2089 (Last row). Left panels:Chandra 0.5-7.0 keV images with represented a portion of the extraction regions. Central panels: Residual images obtained subtracting an elliptical double β-model for the cluster MS 0735.6+7421 and a circular double β-model for the other clusters. Right panels: Surface brightness profiles extracted along the direction of the regions depicted in the left panels.
Current usage metrics show cumulative count of Article Views (full-text article views including HTML views, PDF and ePub downloads, according to the available data) and Abstracts Views on Vision4Press platform.
Data correspond to usage on the plateform after 2015. The current usage metrics is available 48-96 hours after online publication and is updated daily on week days.
Initial download of the metrics may take a while.