Fig. A.5.
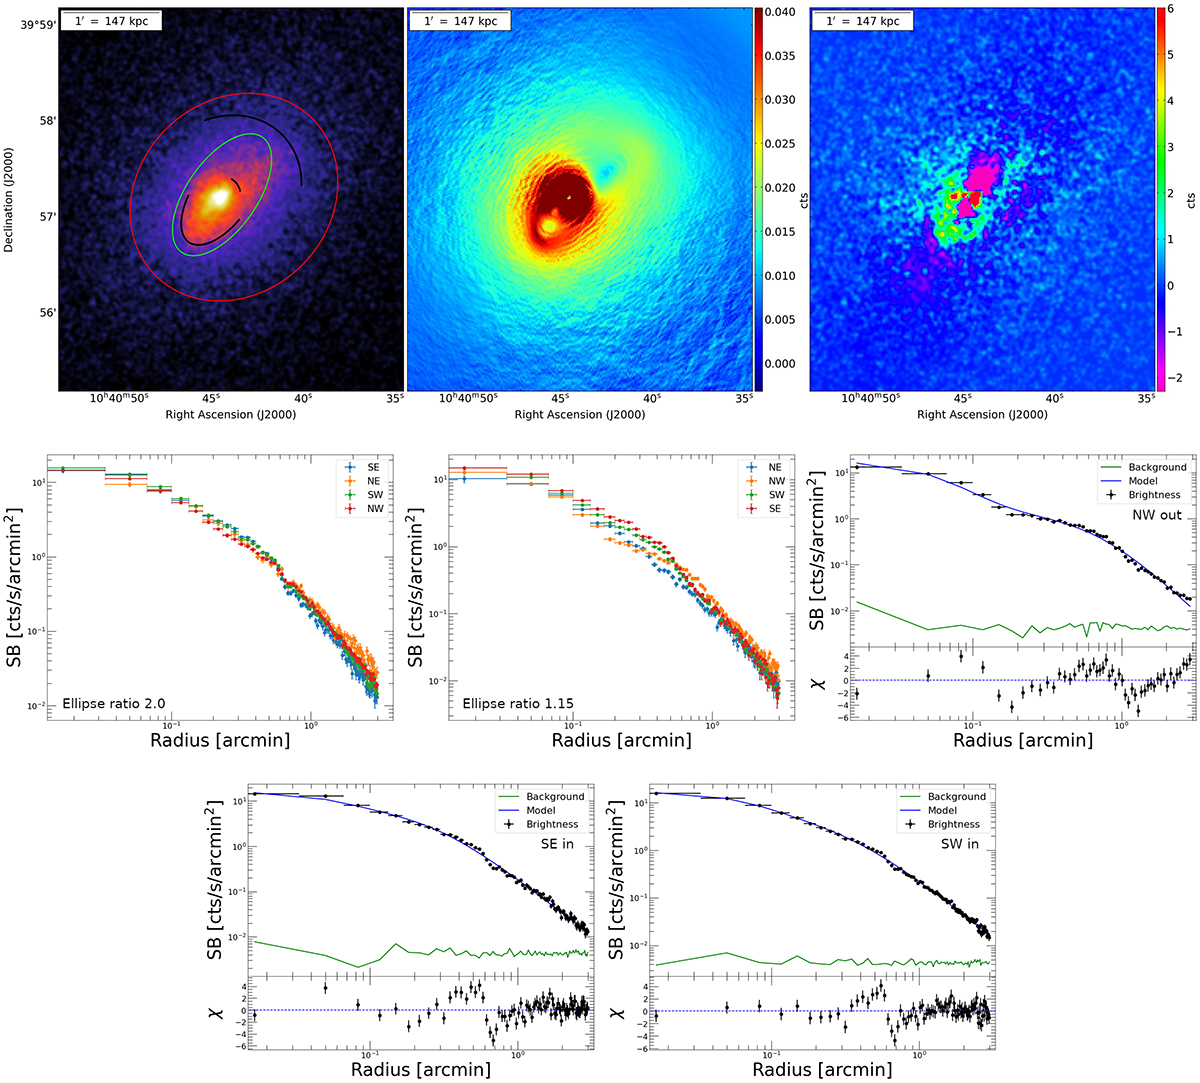
Download original image
X-ray analysis of A1068. Upper left panel:Chandra 0.5–7.0 keV image. The black arcs indicate the position of cold fronts. The green and red ellipses represent the shape of the extraction regions. Upper central panel: GGM filtered image. Upper right panel: Residual image after the subtraction of a double β-model. Middle left panel: SB profiles extracted using regions with ellipticity ratio of 2.0. Middle central panel: SB profiles extracted using regions with ellipticity ratio of 1.15. Middle right panel: best-fitting double β-model (blue line) with associated residuals of the NW profile (ellipticity ratio of 1.15). Lower left panel: same as before for the SE profile (ellipticity ratio of 2.0). Lower right panel: same as before for the SW profile (ellipticity ratio of 2.0).
Current usage metrics show cumulative count of Article Views (full-text article views including HTML views, PDF and ePub downloads, according to the available data) and Abstracts Views on Vision4Press platform.
Data correspond to usage on the plateform after 2015. The current usage metrics is available 48-96 hours after online publication and is updated daily on week days.
Initial download of the metrics may take a while.